Using the 'Activity Panel', learn how to effectively filter and monitor your real estate sales activity within the Dynamic Agent dashboard. Specifically focusing on the 'Activity Panel'. This guide walks you through accessing companywide and using the 'Branch Panel' specific branch data, reviewing performance metrics, and managing listing details.
Alert: Alert! The data that is visible in the Dynamic Agent screen is dependent on the access permissions that you, as a user, have been granted. If you believe you have the incorrect settings, please refer to your Manager/internal Dynamic Agent support.
There may be a difference in the options you see on screen, this may be dependent on the options your company has selected.
Activity Panel
1. Navigate to https://dynamic-agent.co.uk/activity-panel/
Click here to access the 'Activity Panel' screen. This screen gives the ability to look at 19 data points or 'Activities', each of those activities can be further filtered to show data in different ways.
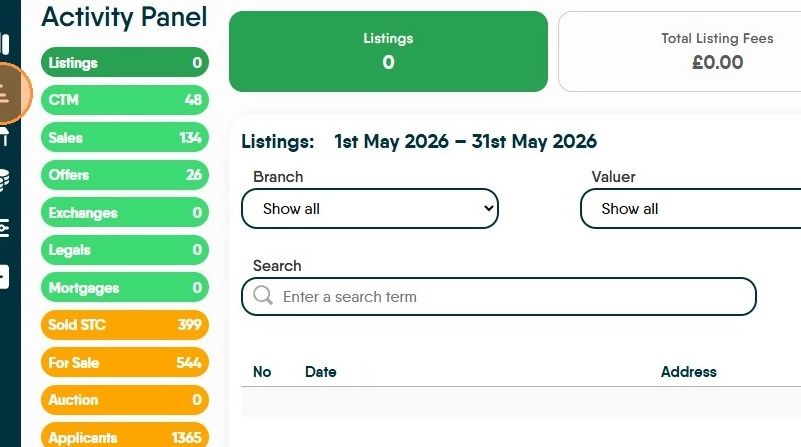
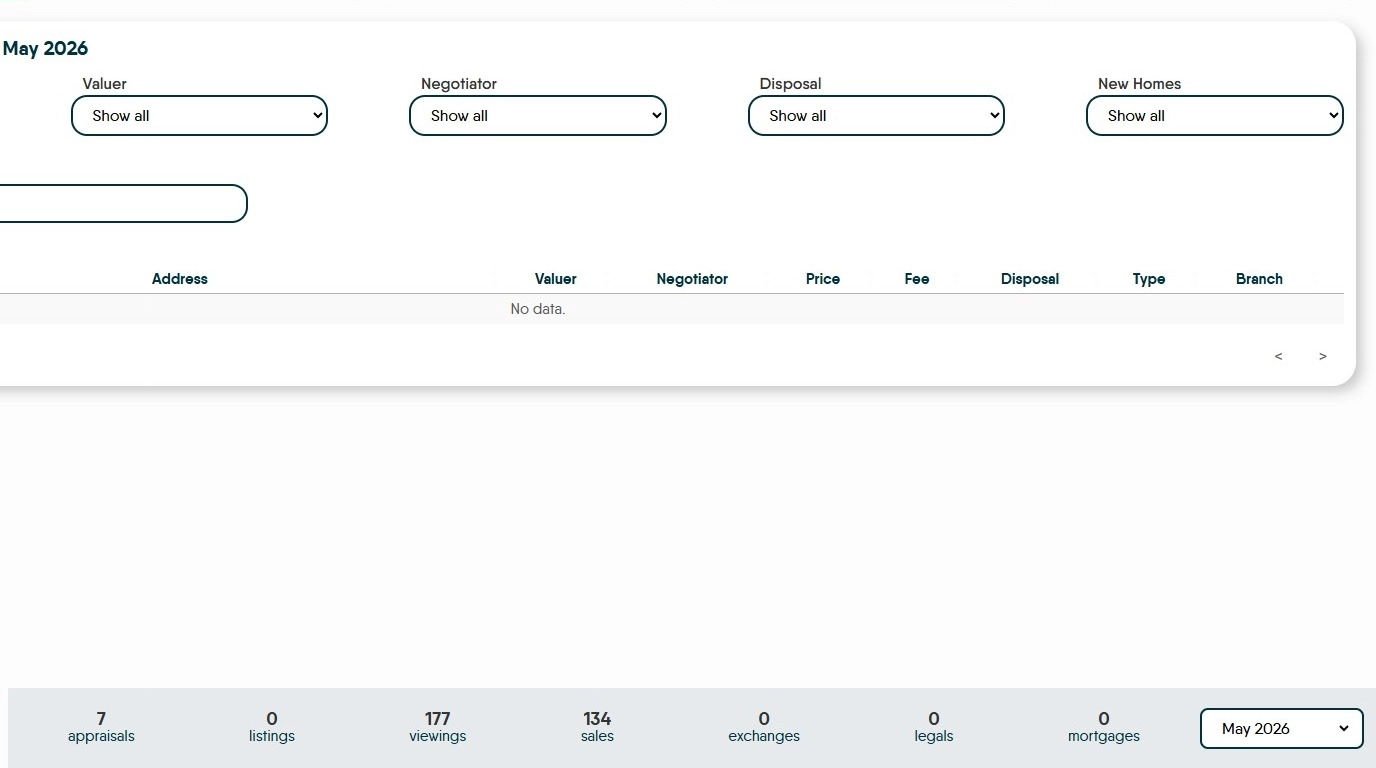
2. At the bottom right corner is an option to change the month. For example, at the start of a month there may be no data available and you may want to review the previous month. Select the month required e.g. "April 2026" from the date range selector.
As each of these screens looks very similar we will look at the 'Listings' screen as an example rather than showing all the screens in detail.
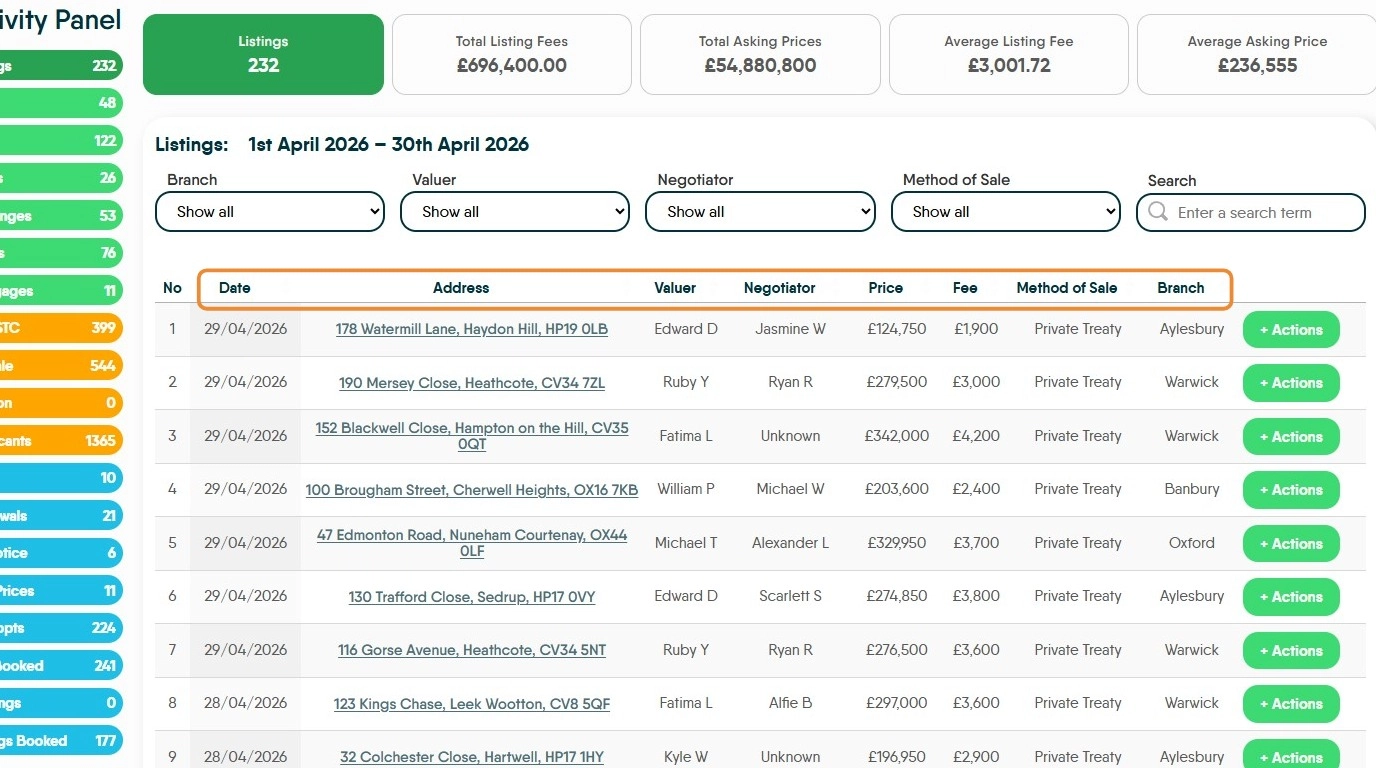
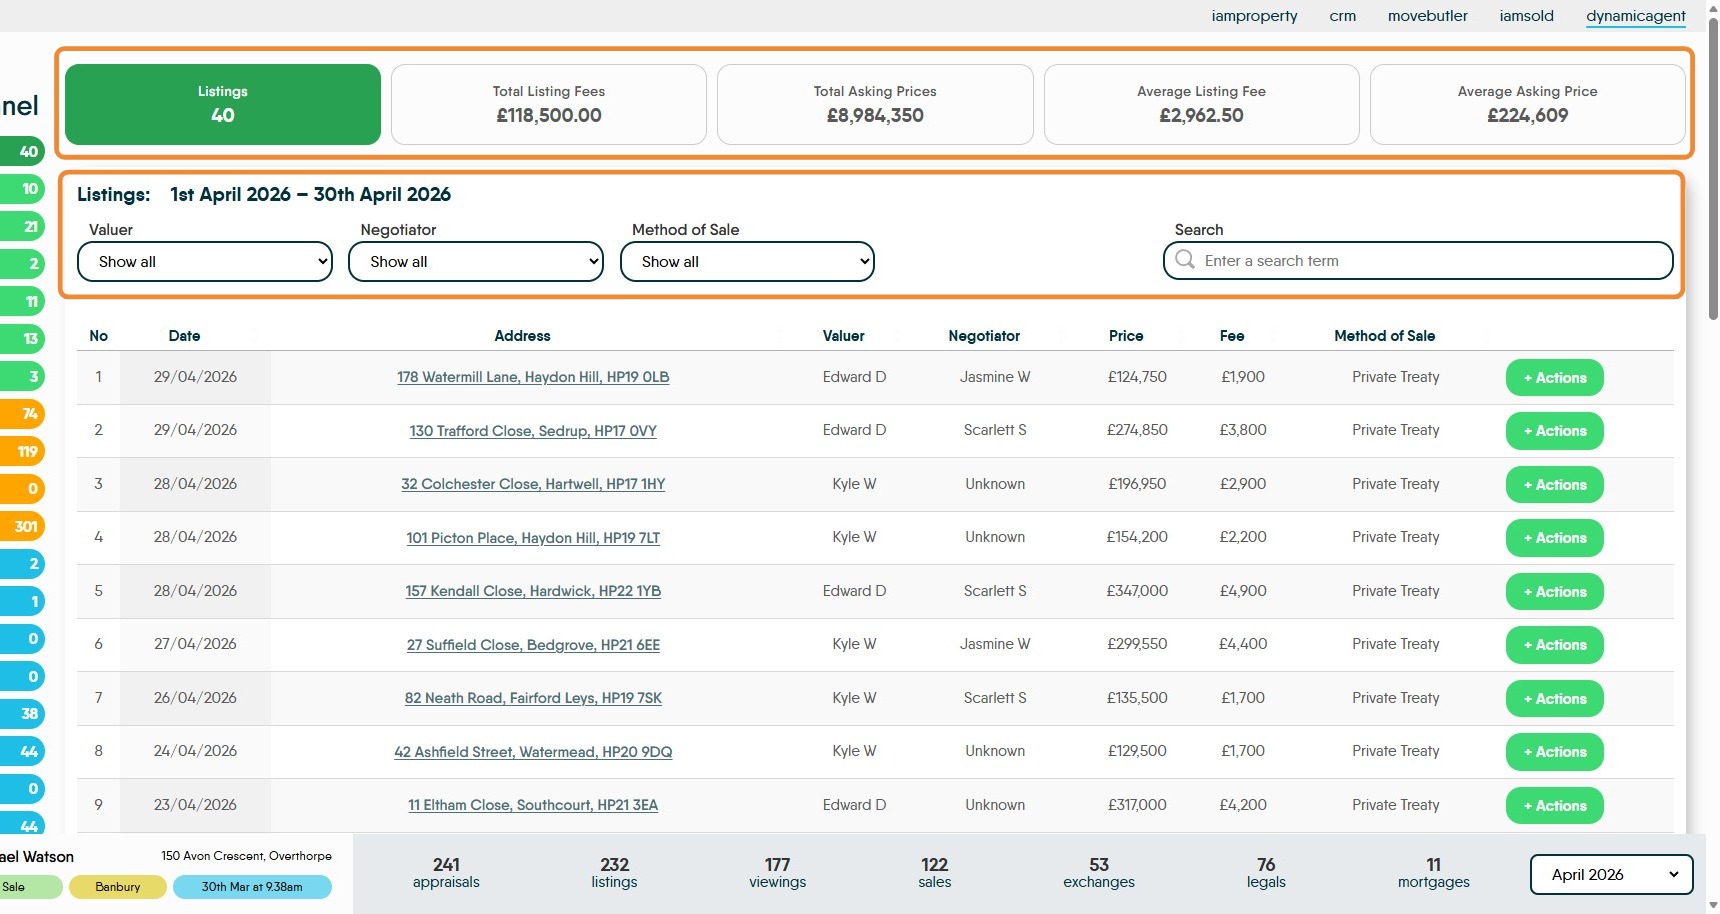
3. The first screen shown is Listings. This screen will show the total listings for the month selected. The on screen data can filtered be using the on screen filters to give a wide range of possible data outputs.
Across the top of the screen are the totals for the 'Listings' data you have access to.
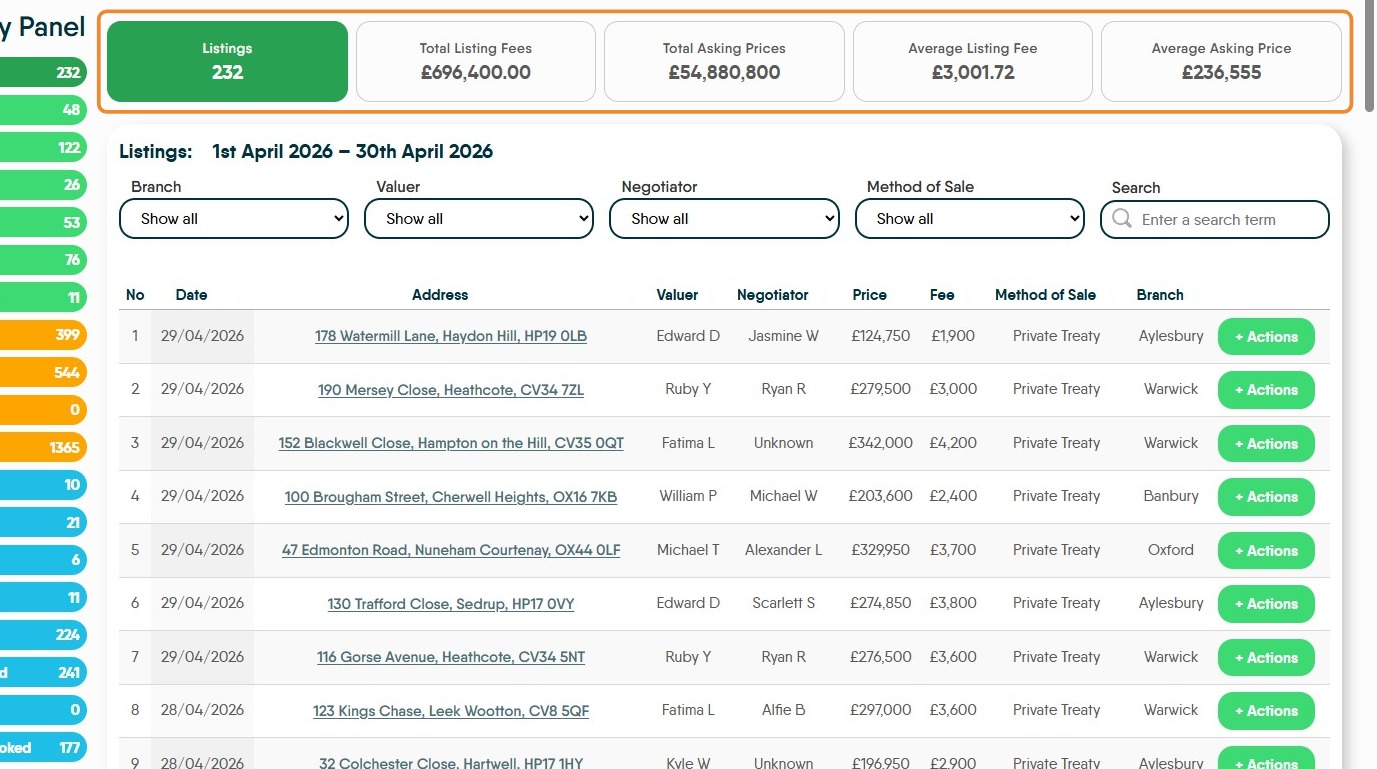
4. The data can also be sorted using the column headers e.g Data, Valuer, Negotiator etc. The highlighted options are clickable.
Clicking on the header sorts the list by ascending or descending order.
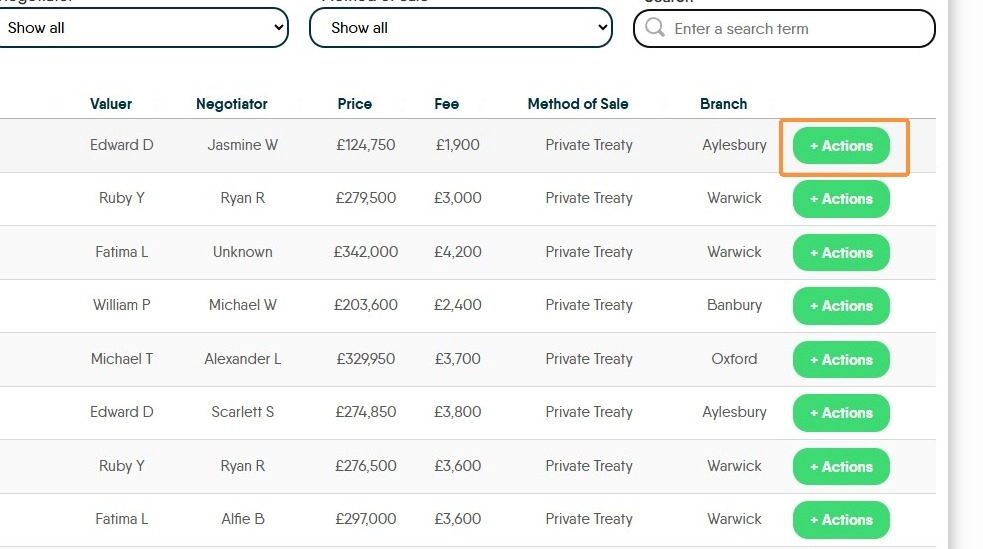
5. Click "+ Actions" next to a listing to see management options. The 'CRM...' options will take you to iamproperty CRM for further details.
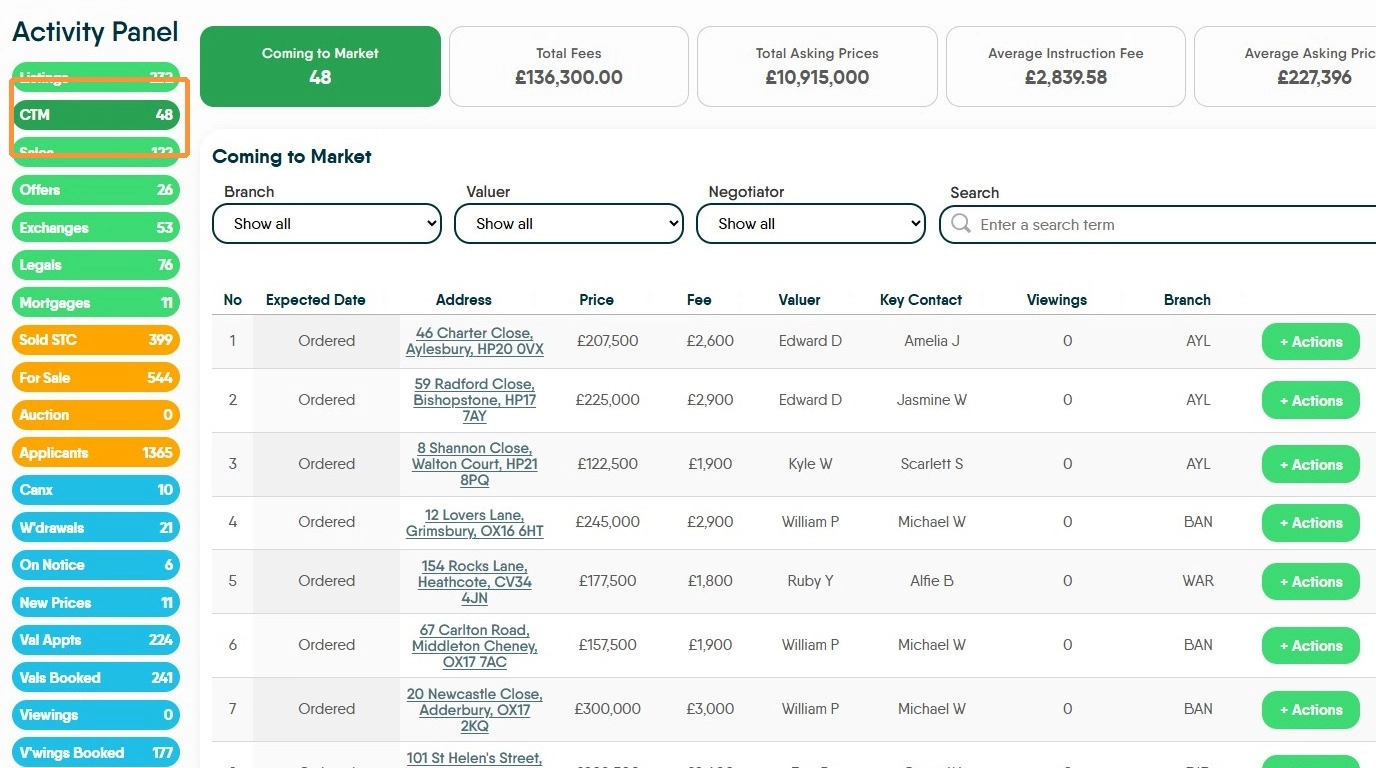
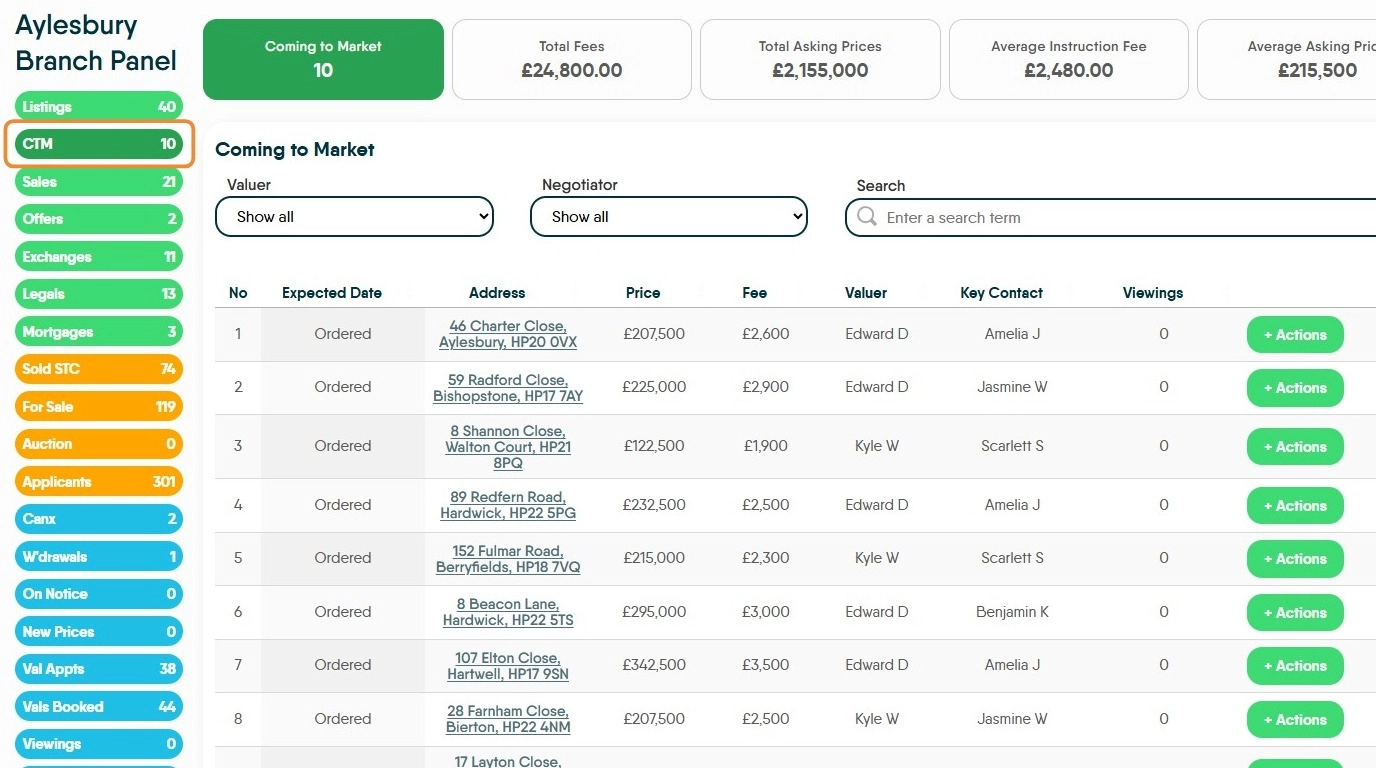
6. The Green options. "CTM" "Sales" "Offers" "Exchanges" "Legals" "Mortgages"
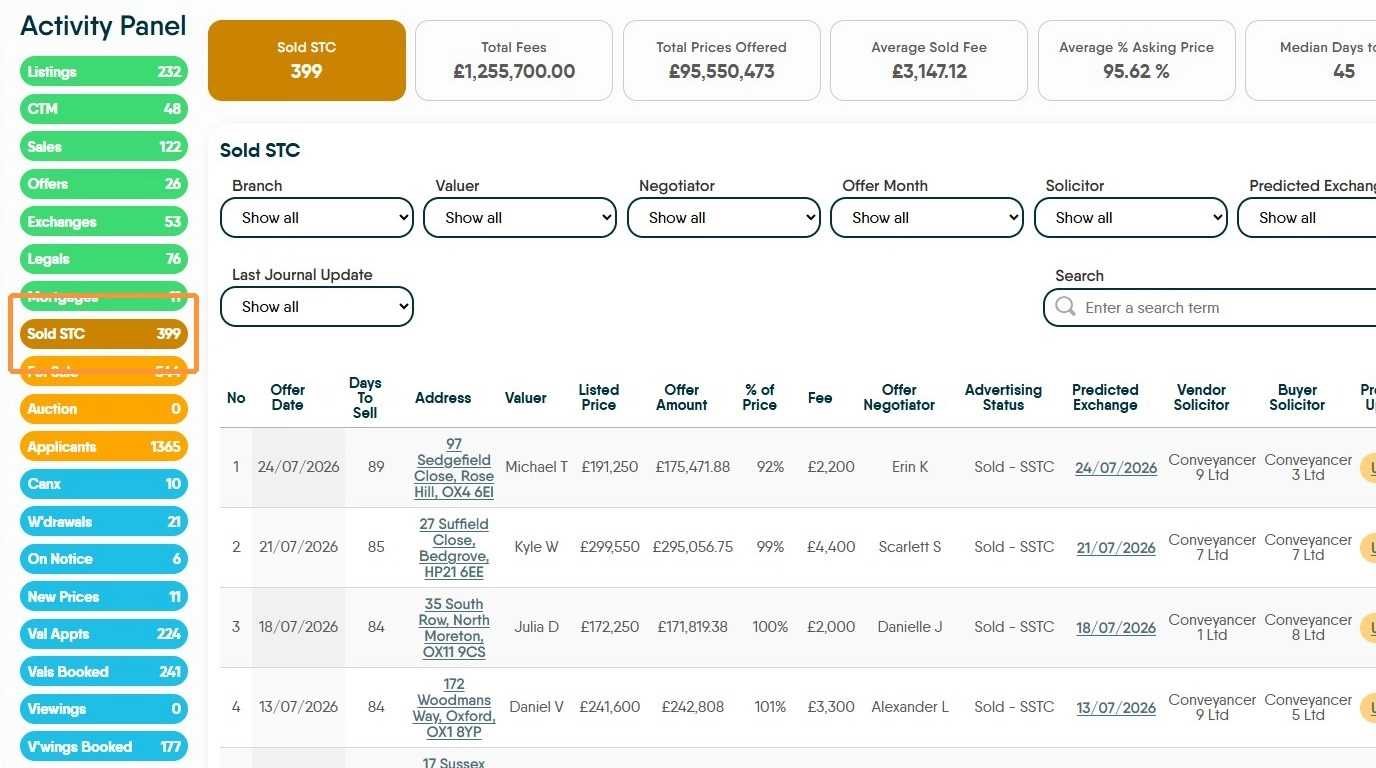
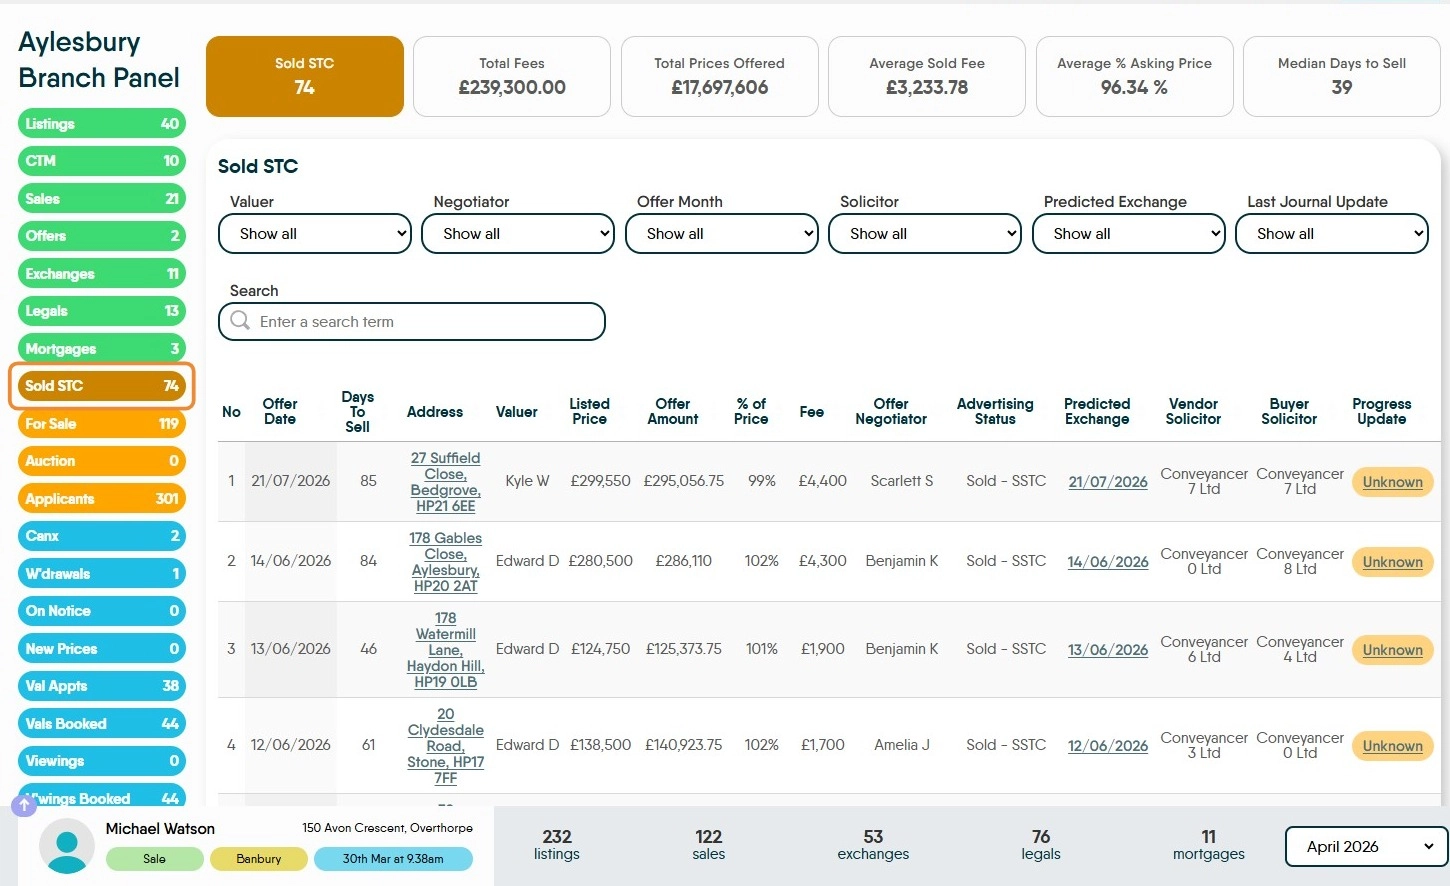
7. The Amber options. "Sold STC" "For Sale" "Auction" "Applicants"
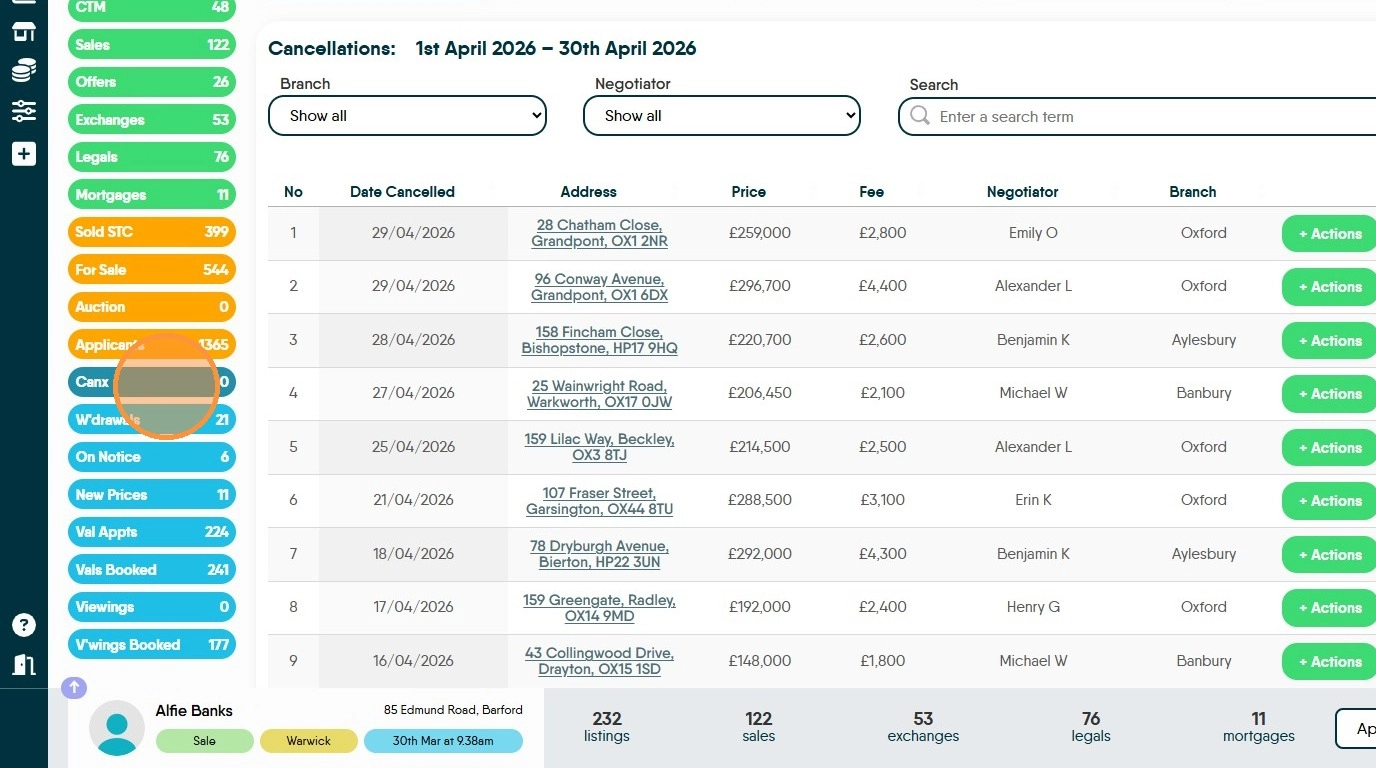
8. The 'Blue' options "Canx" "W'drawals" "On Notice" "New Prices" "Val Appts" "Vals Booked" "Viewings" "V'wings Booked"
'Branch Panel' Navigation
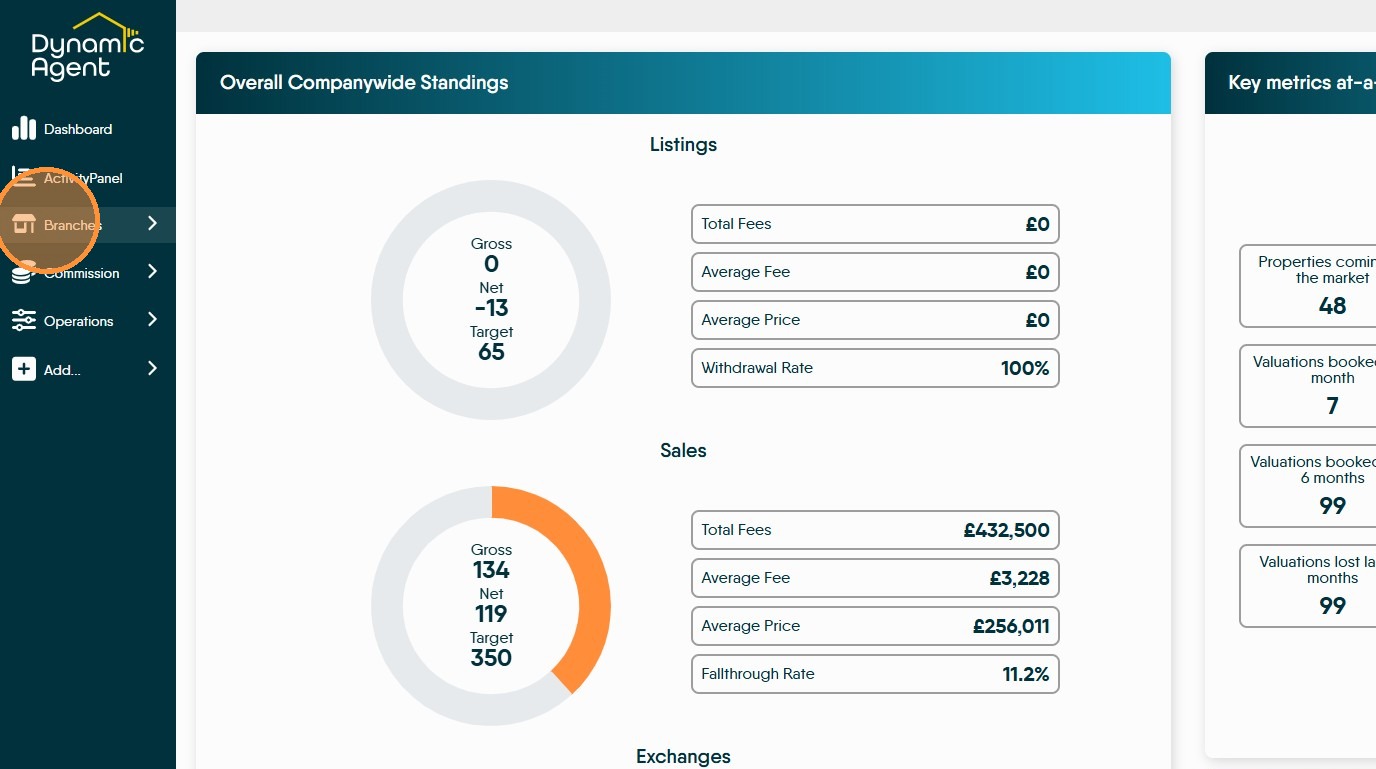
9. Click "Branches"
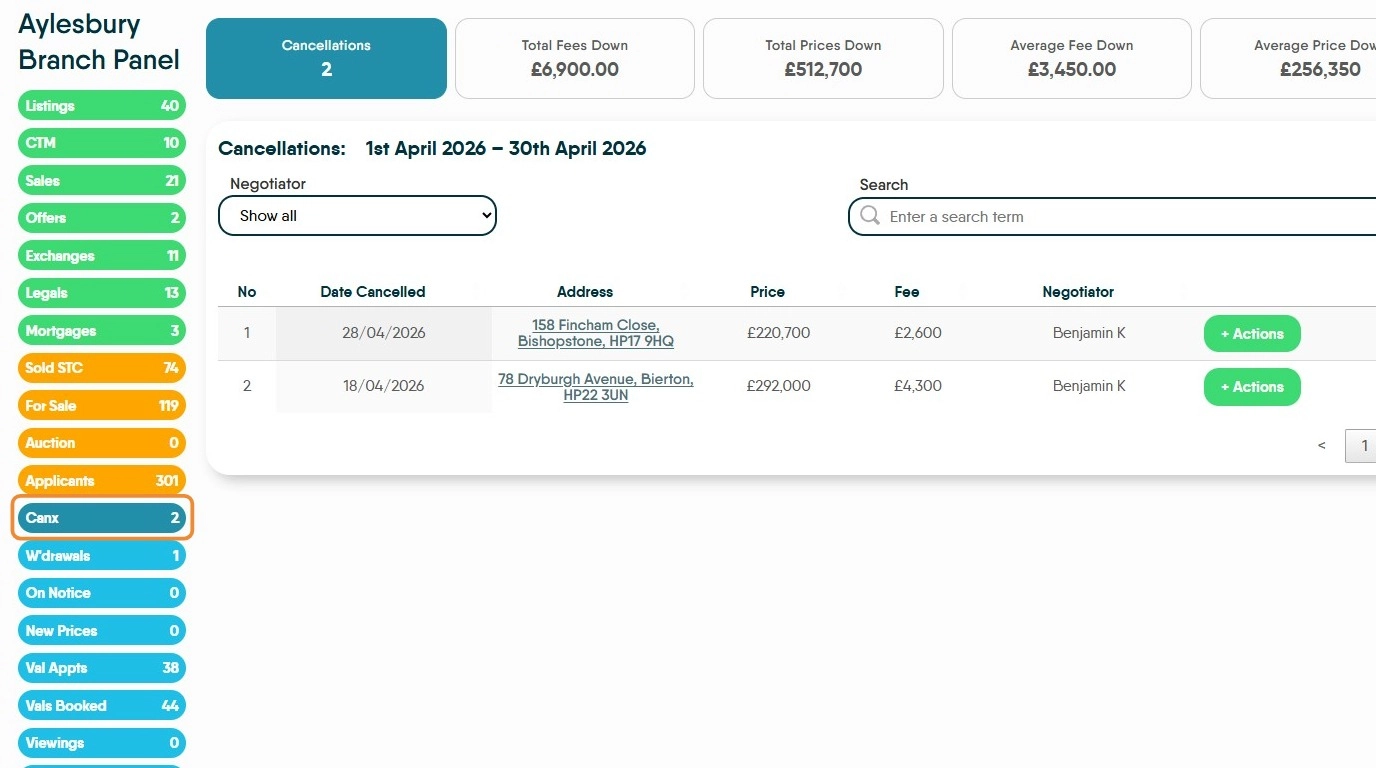
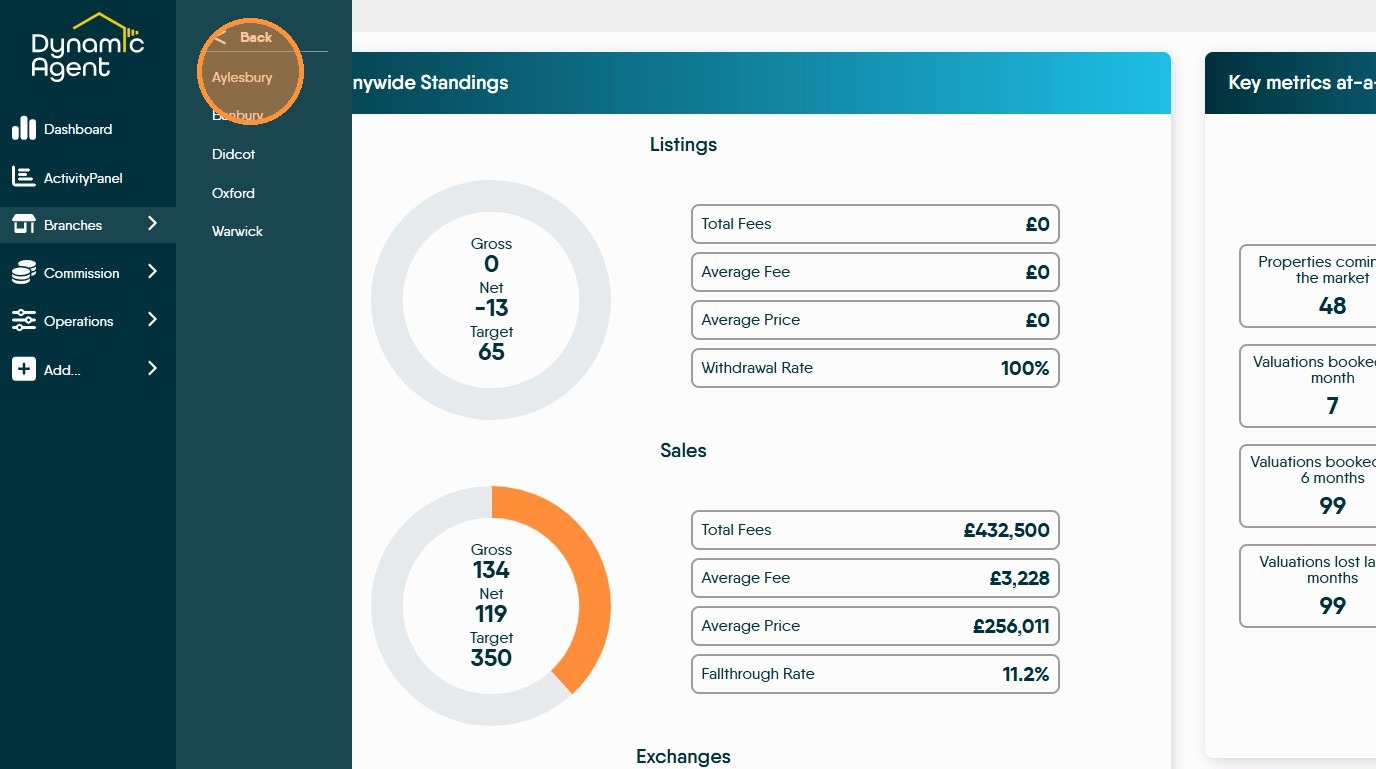
10. Click the branch whose data you want to review e.g. "Aylesbury"
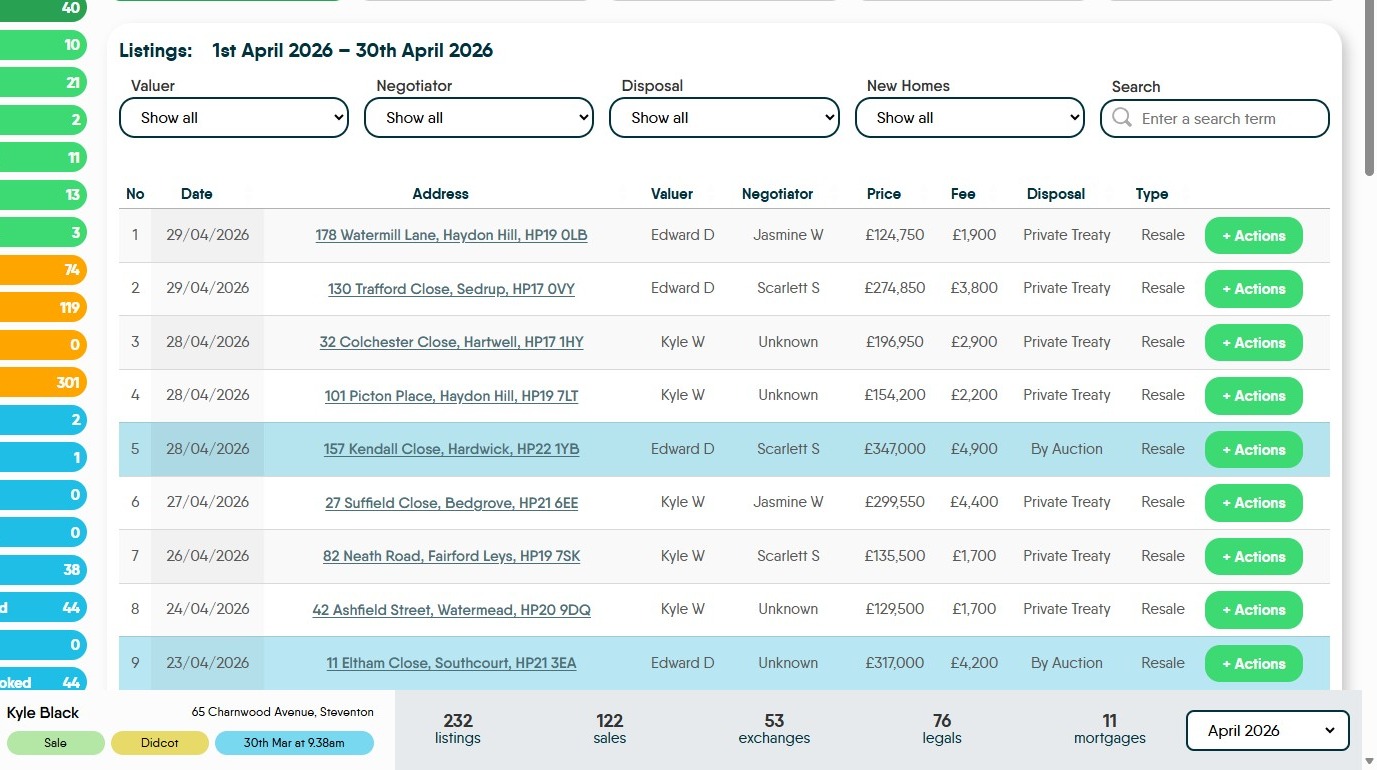
11. This screen shows the data for the selected branch. The data shown is dependent on the option selected on the left side of the screen, in this case 'Listings'. These are the same options that are shown on the 'Activity Panel'
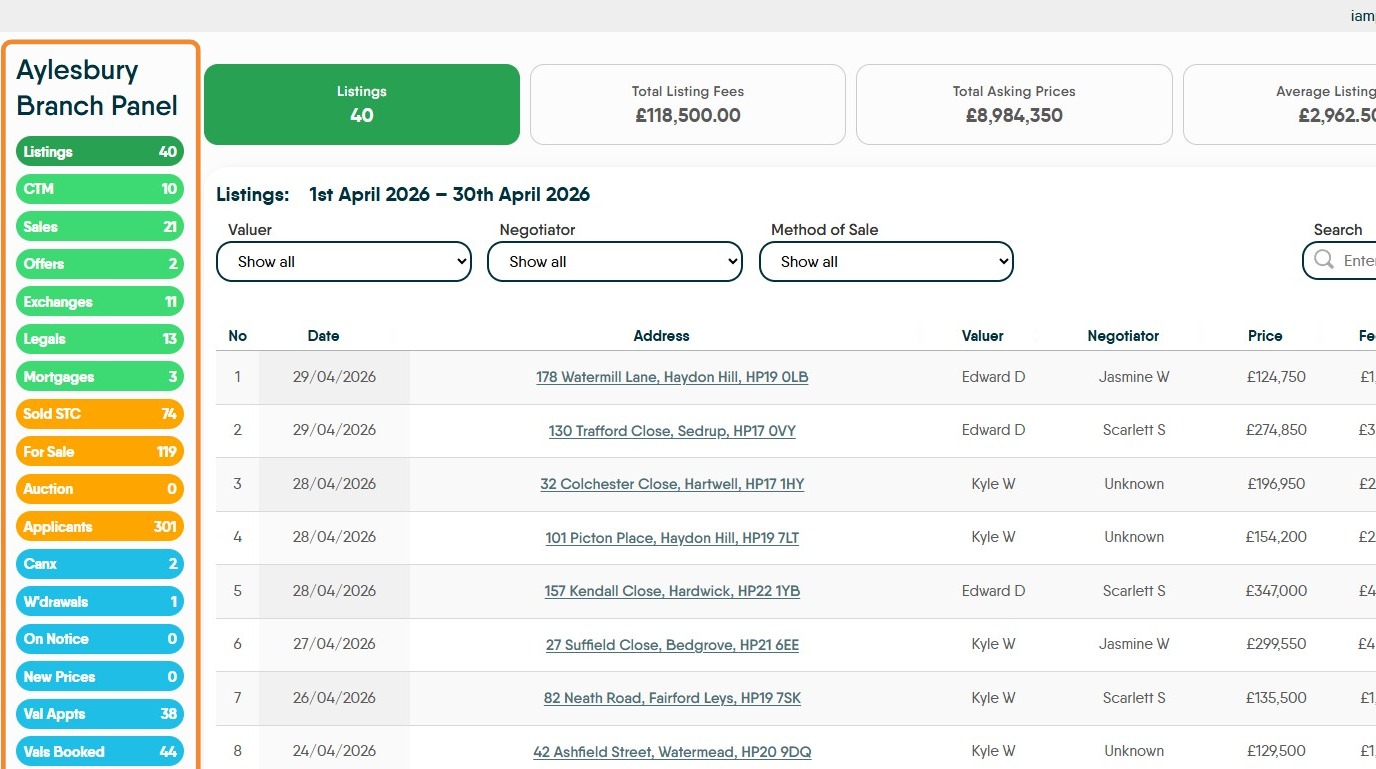
12. For every data set shown, at the top of the screen are the cumulative figures for the data set selected in this case 'Listings'.
Every screen has a set of search option, these may change due to the data type selected from the left menu. As with previous screens the data can also be sorted by clicking on the column headers
13. Clicking "+ Actions" will show a set of options that will allow you to refer back to the original record in CRM, edit or delete details etc.

14. In this case, Listings, there are highlighted lines. These are showing the properties that are being listed for Auction.
15. The other views available are;
Click "CTM"
Click "Sales"
Click "Offers"
Click "Exchanges"
Click "Legals"
Click "Mortgages"
17. Click "Sold STC"
Click "For Sale"
Click "Auction"
Click "Applicants"
18. Click "Canx"
Click "W'drawals"
Click "On Notice"
Click "New Prices"
Click "Val Appts"
Click "Vals Booked"
Click "Viewings"
Click "V'wings Booked"