Learn how to effectively navigate the Dynamic Agent Performance Dashboard, to access comprehensive company wide performance metrics. This screen gives a complete overview of the performance of a Company, Branch or individual performance depending on permissions granted to the user. This guide helps users quickly locate branch standings, individual team member KPIs, and monthly target tracking data.
Dynamic Agent Dashboard Overview
1. Navigate to https://dynamic-agent.co.uk/ log in using the details provided.
Alert: Alert! All the data on this screen is controlled by the settings created for your designated job role and the Month option selected at the bottom right of the screen.
This document is showing the screens available for a user with full access to Dynamic Agent.
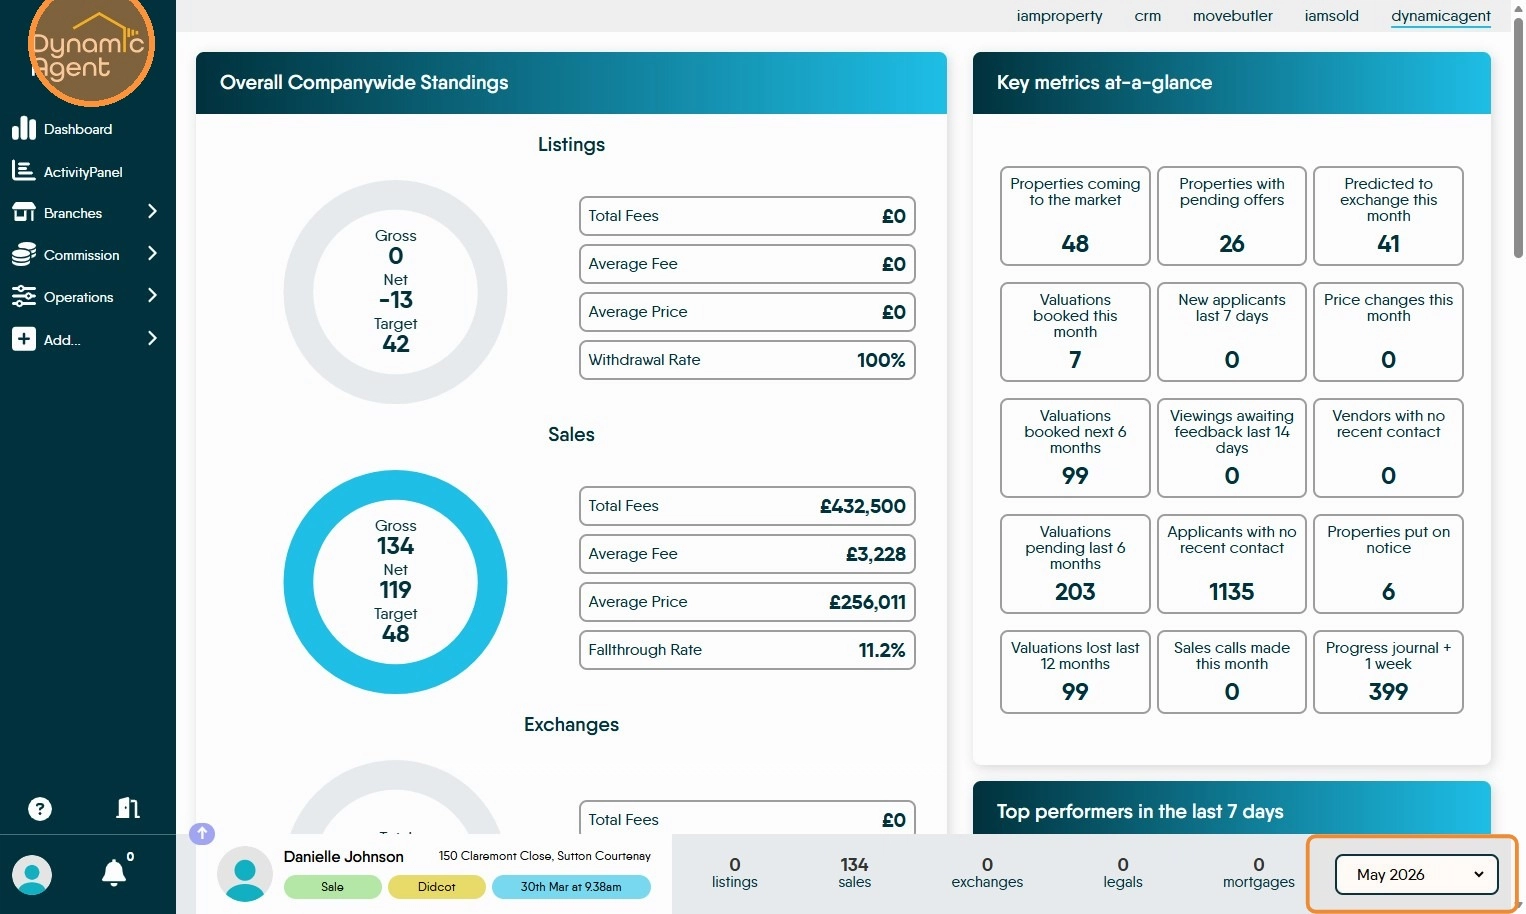
2. The Dynamic Agent Dashboard, this is the first screen that you will see and shows all the key data to help manage your own, your branch or company performance.
There are various tiles showing information based on your user setup and (by default) is the current months data.
All of the date based information shown in these screens is controlled by the date option (bottom right) this is selected at the bottom of the screen (highlighted).
Throughout this guide we will look at each of the screens individually.
Alert: All the data and screens shown in this guide are based on a user having 'Full' access to Dynamic Agent (e.g. a Director/Owner/Administrator), if the user is setup as a Negotiator they may see less data or data for their branch only.
Overall Companywide Standings
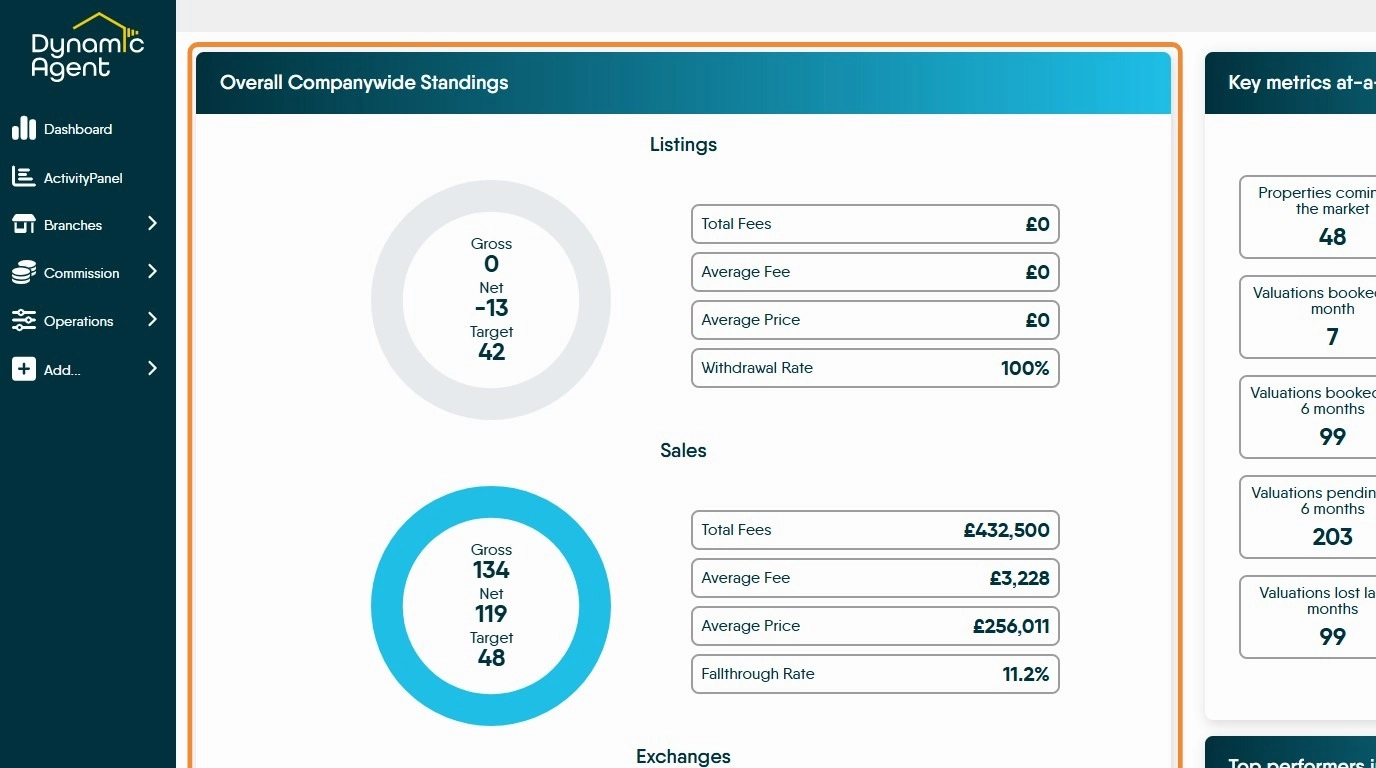
3. This screen has a large amount of information on it, in the following section we will look at each screen individually. As mentioned previously, each of these screens are personalised by the user settings and may only show you your branch data
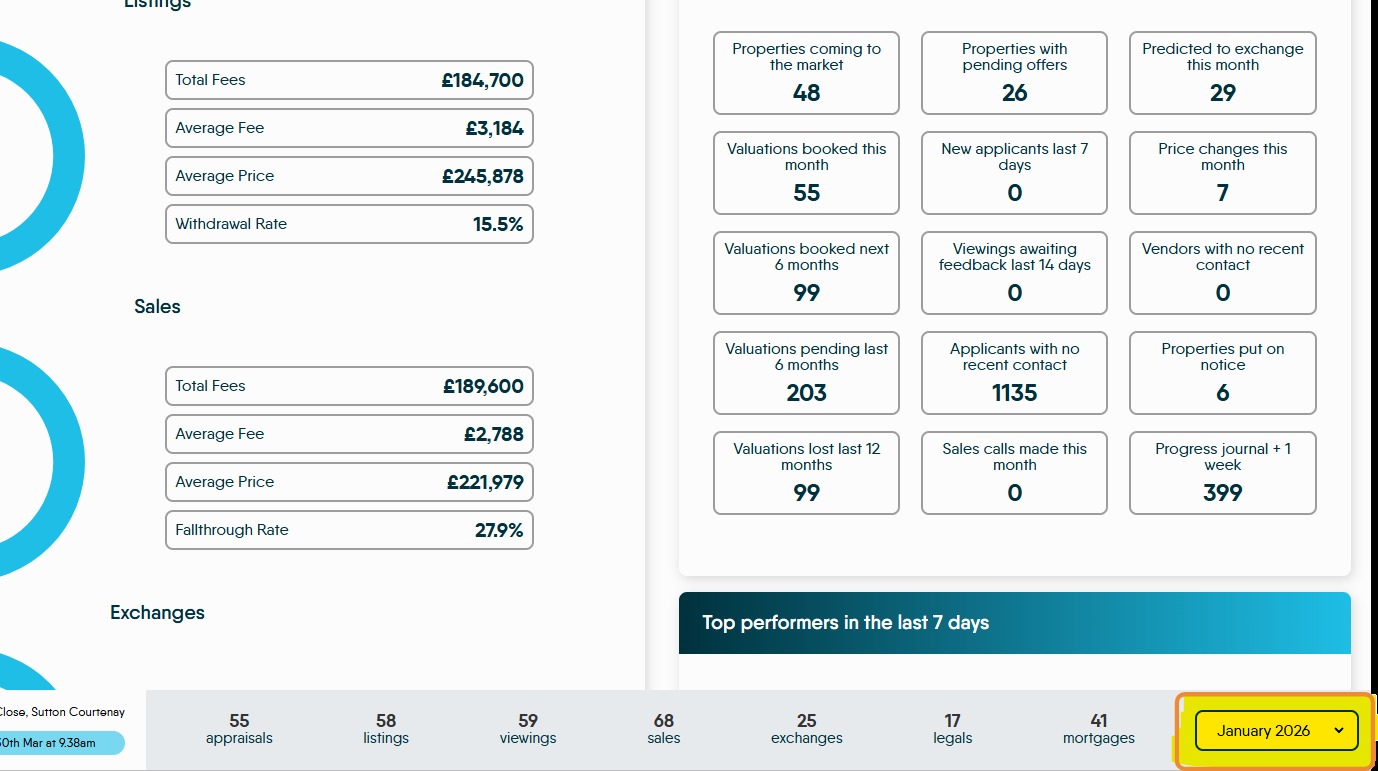
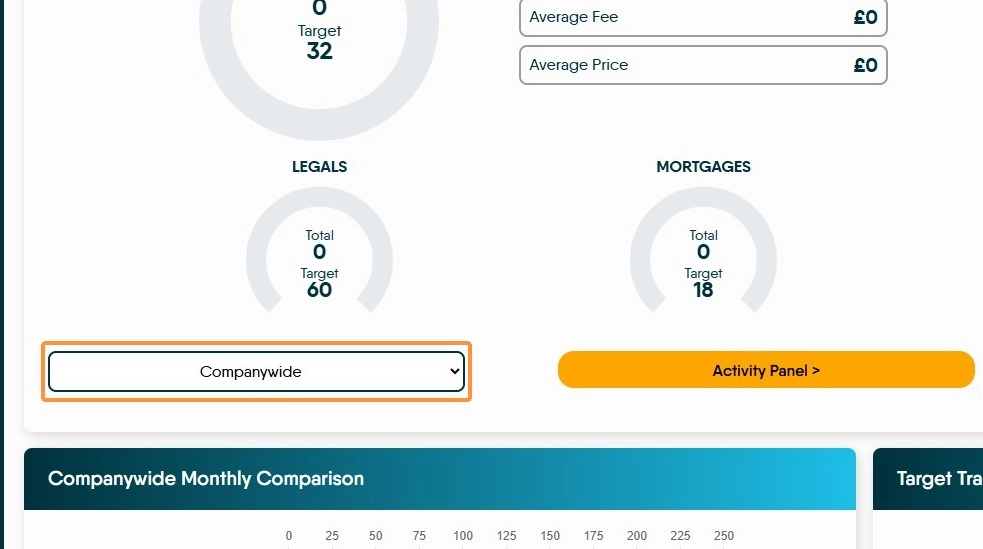
4. "Overall Company wide Standings" This shows the information for Listings, Sales, Exchanges, Legals, Mortgages.
For Listings, Sales and Exchanges, Gross (total for Exchanges), Net and Target are shown in the roundel and Total Fees, Average Fee, Average Price and Withdrawal Rate (for Listings and Sales) are shown in the individual boxes.
For 'Legals' and 'Mortgages' total and target are shown. Below this is a menu to access the 'Activity Panel' (for more info on this click here ) allowing more detail to be added to the data on screen.
These are fixed data screens and the information displayed is based on the date set at the bottom of the screen and any specific User settings that restrict access to information.
5. To further filter the data clicking this drop down menu will allow you to select the data for a specific branch to review.
Key metrics at-a-glance
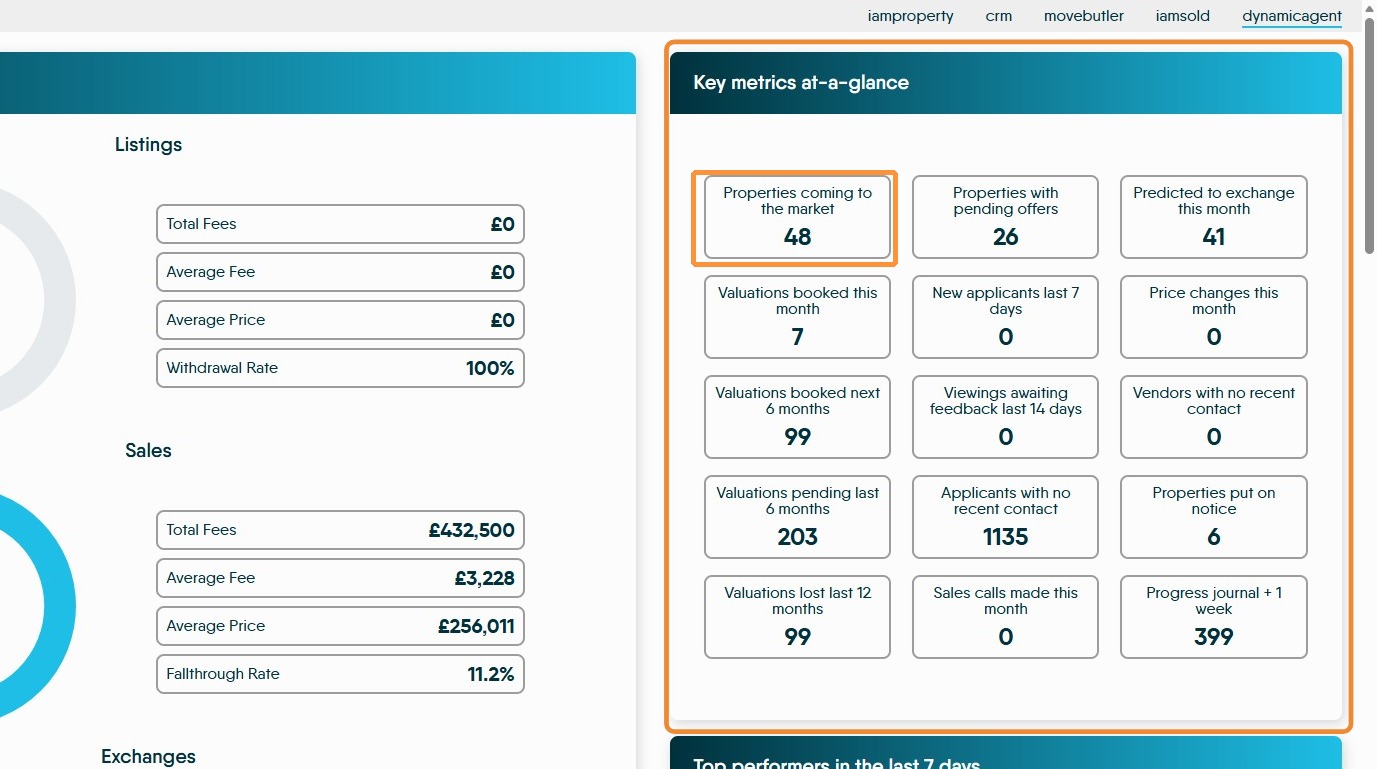
6. "Key metrics at-a-glance" provides a suite of clickable options that can drill down into the key metrics for your branch or company.
Each of these tiles is 'clickable' and will, when clicked, take you to the related screen in the 'Activity Panel'. For example, selecting the 'Properties Coming to the market' option will take you to the CTM screen in the Activity Panel.
These options are also available via the 'Activity Panel' option in the left menu.
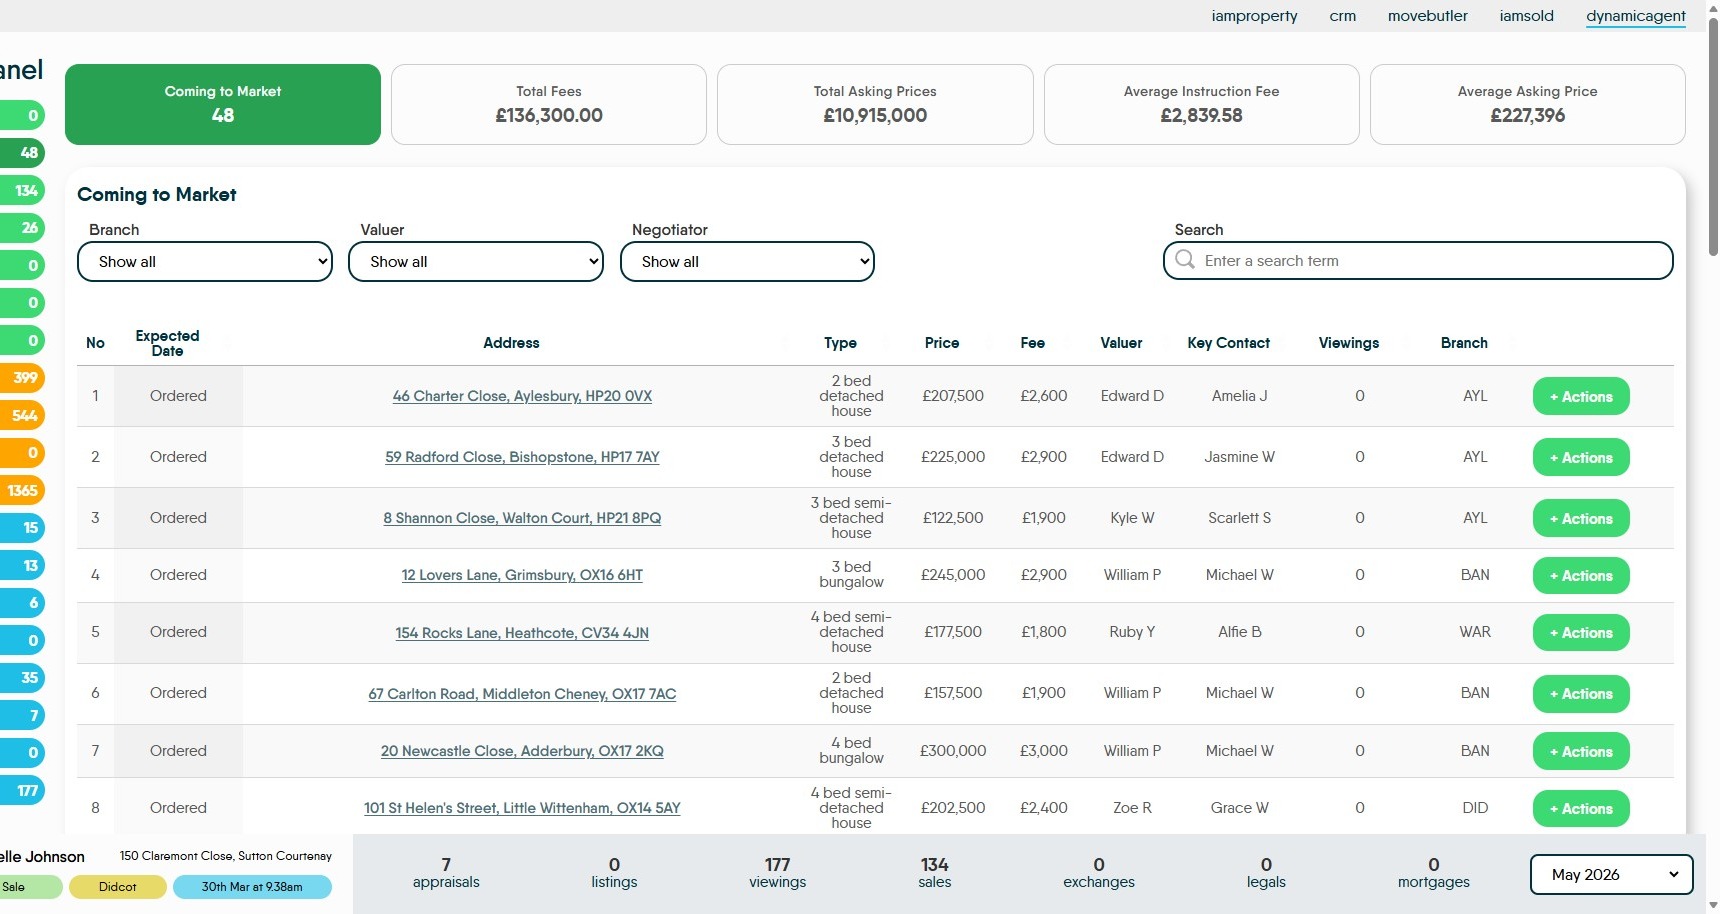
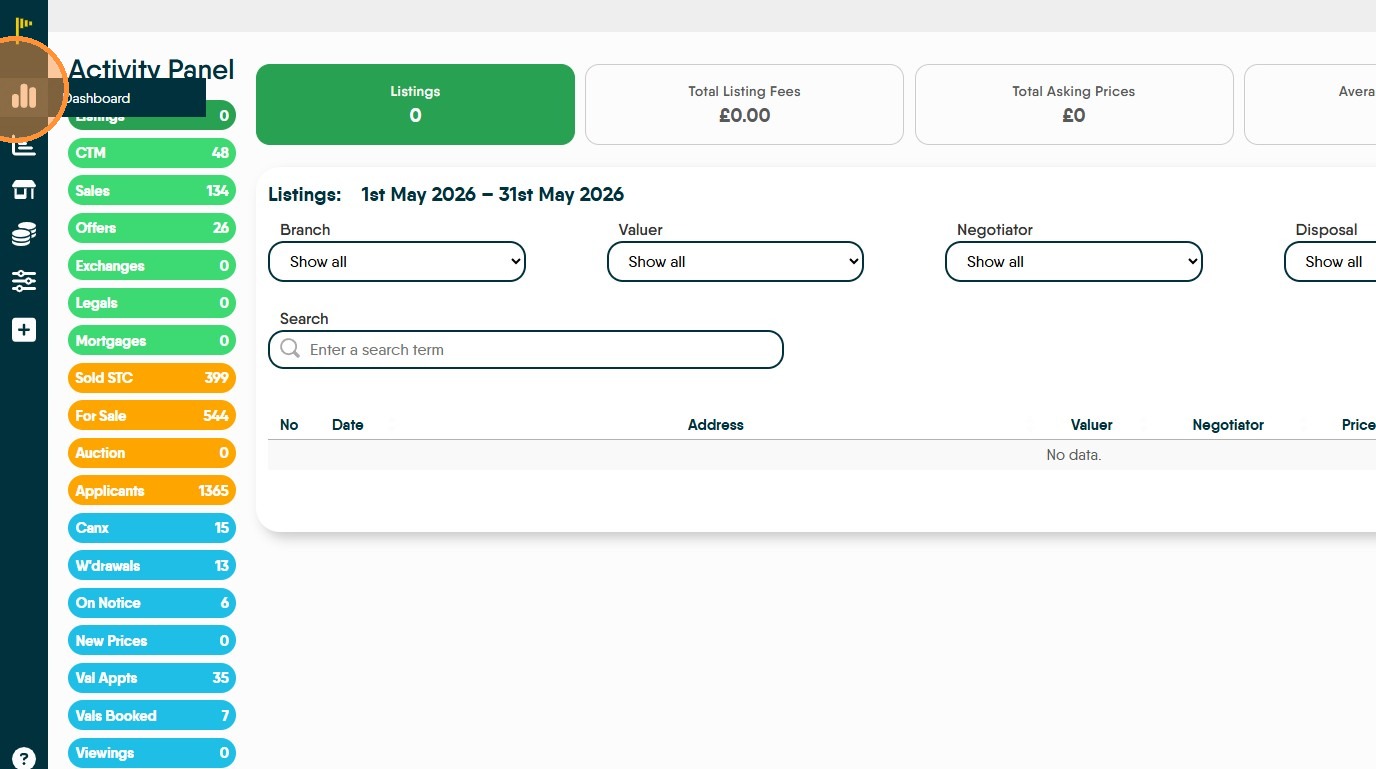
7. For example, once the option is selected you will be taken the the Once in the CTM screen. Use the drop-down menus to filter results by Branch, Valuer, or Negotiator.
The 'Coming to Market' screen shows you properties that are coming to market, at the top of the screen the totals for Total Fees, Total Asking Price, Average Instruction fees and Average Asking Price are shown.
The Expected Date is shown to the left of the screen. Also shown is address, Property Type, Price, Fee etc.
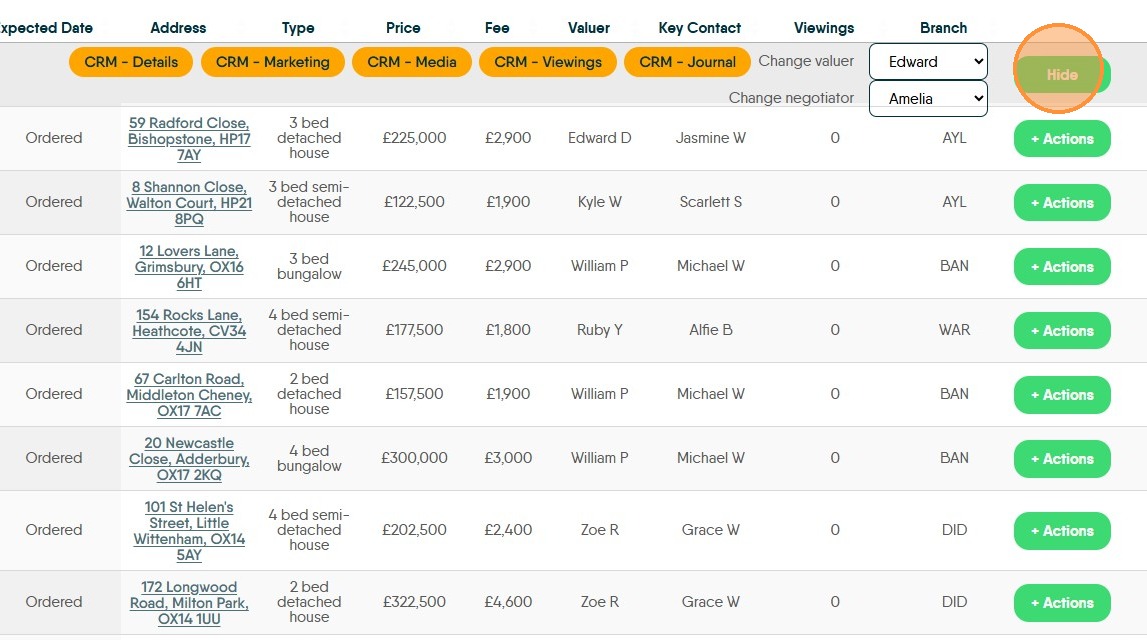
8. Click "Actions." this allows access to other details in CRM via the orange buttons, as well as the ability to change the valuer and negotiator records.
9. Click the Dashboard icon to return to the dashboard screen.
10. "Companywide Monthly Comparison" to review the whole company performance over this month and the previous month last year e.g. April 2026 v May 2025.
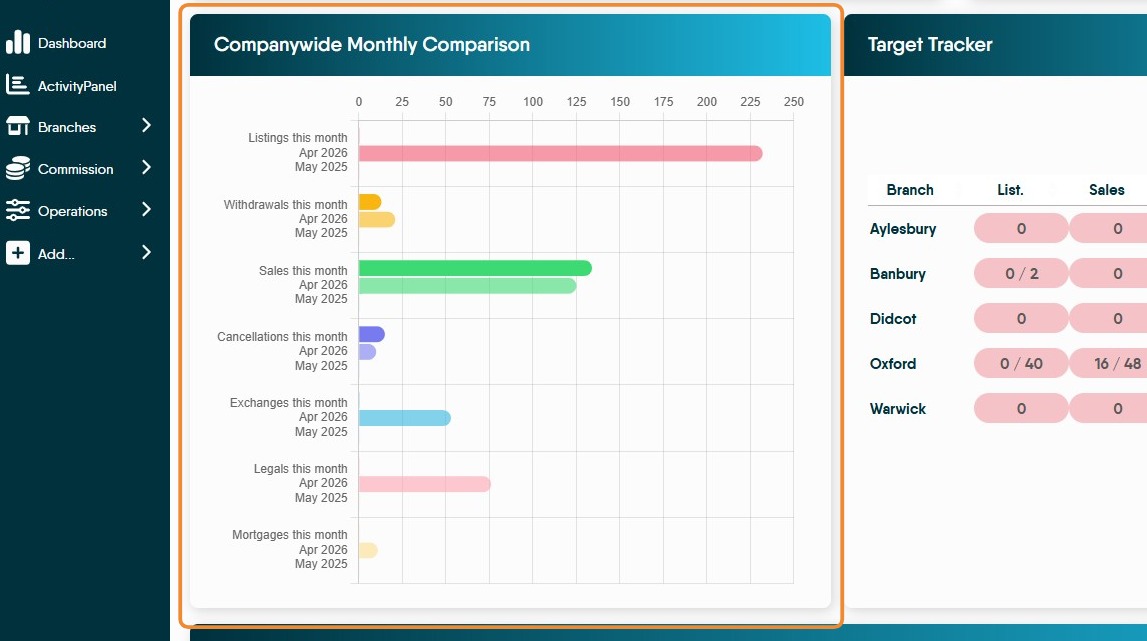
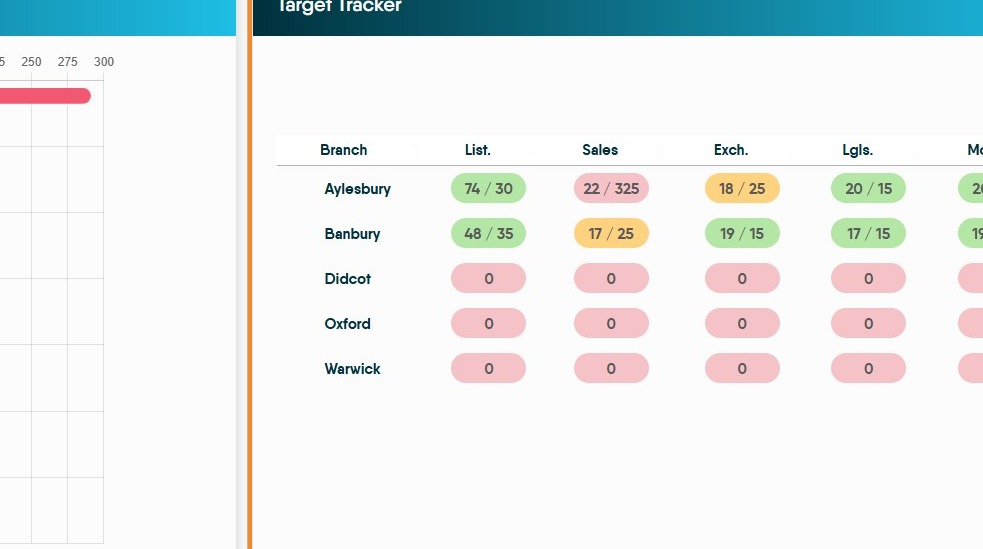
11. Click "Target Tracker" to view the Branch performance against targets and in relation to other branches in the company. If a target is hit the it will be coloured green, if still in progress it will be coloured Orange
League Tables
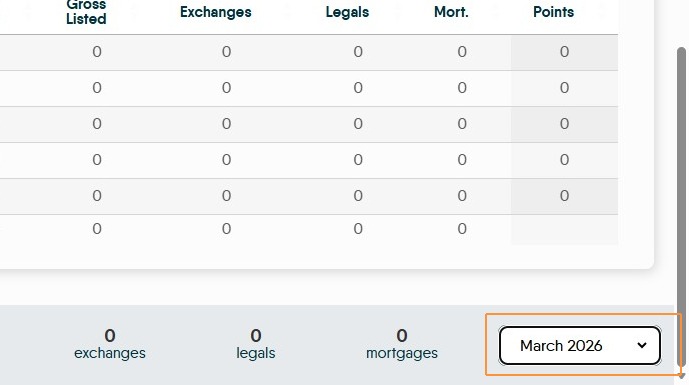
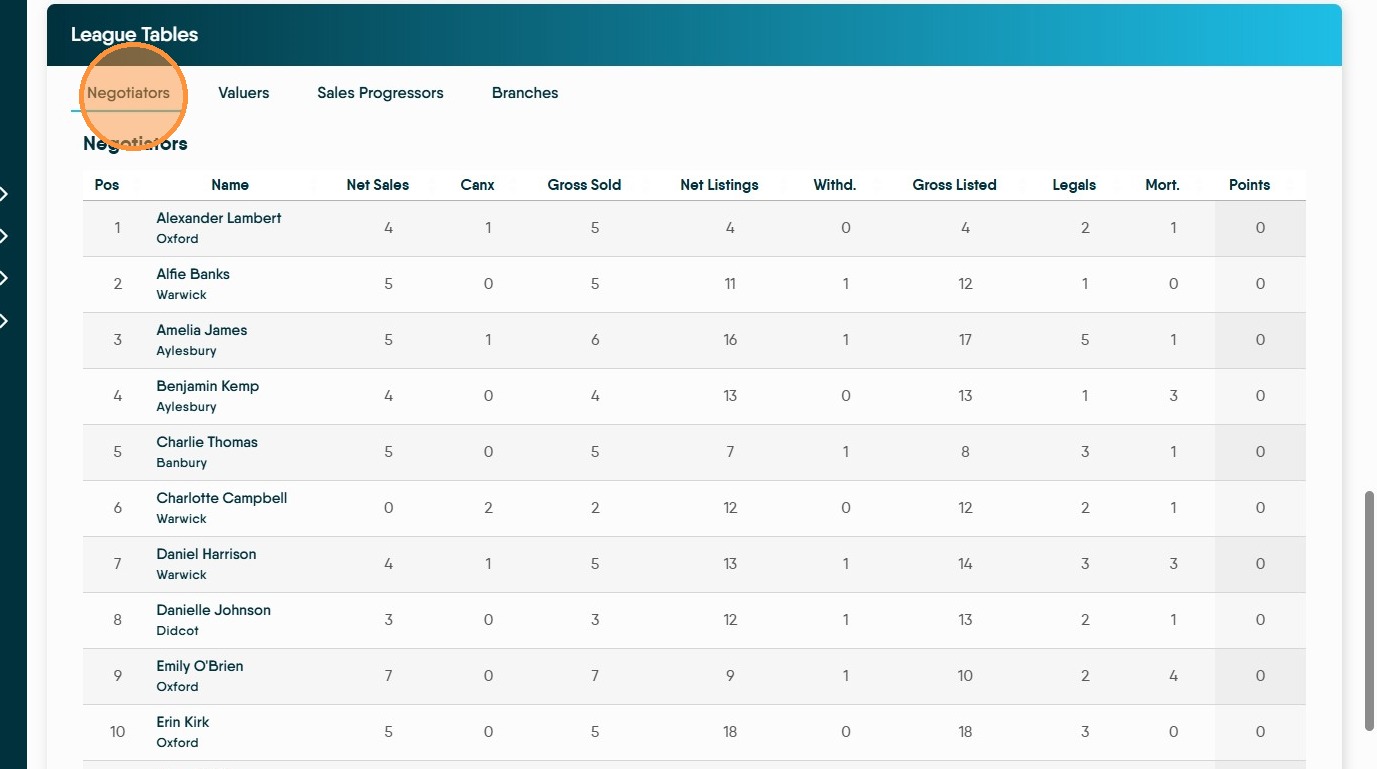
12. Across the bottom of the screen is a "League Tables" section to view performance rankings for Negotiators, Valuers, Sales Progressors and Branches this is dependent on setup and User config.
For each of these league tables the column headers can be selected to sort the column by ascending or descending order. N.B. the information displayed is still controlled by the 'Date' filter in the bottom right corner of the screen.
13. The 'Negotiators' tab shows all Negotiators in a league table against their colleagues, using 9 different metrics that can be used to rate performance.
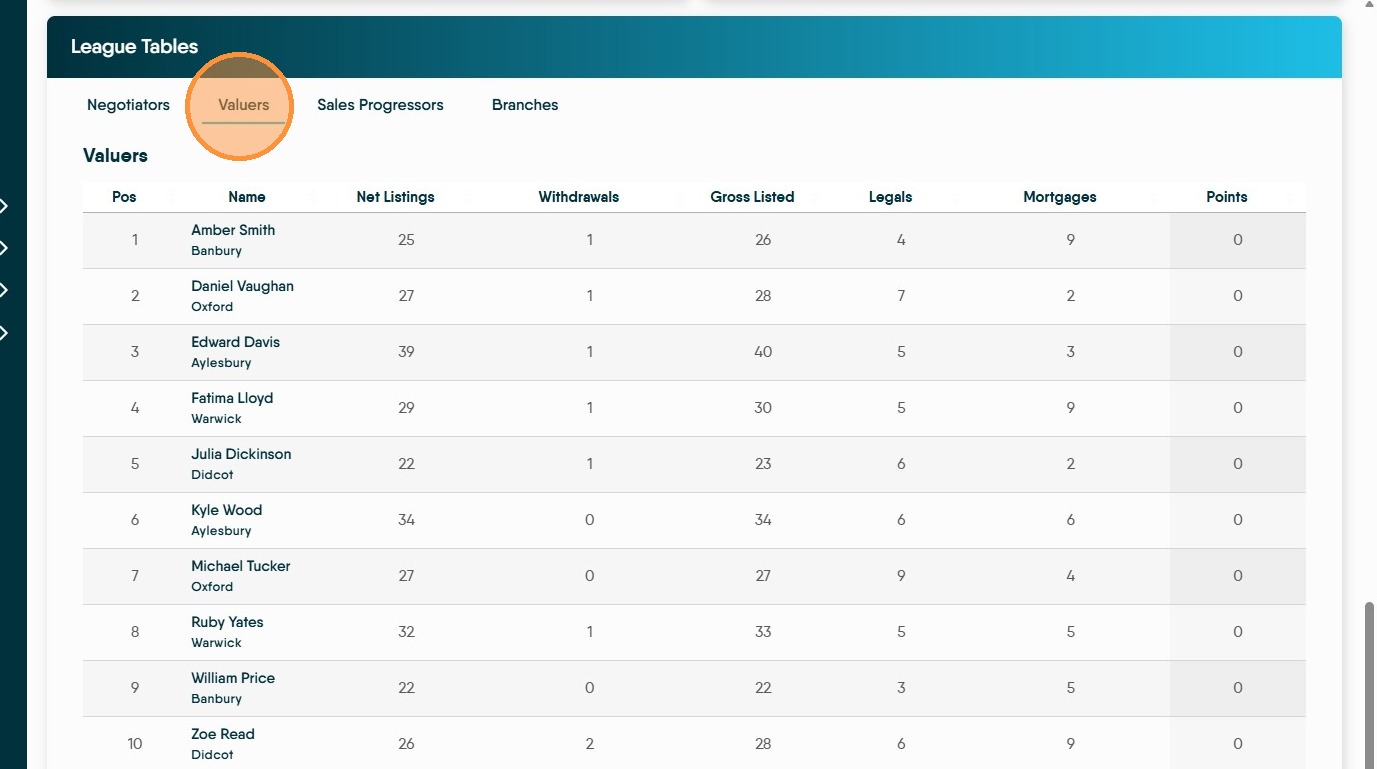
14. Select the "Valuers" tab within the League Tables. This give 6 metrics which are used to rank the Valuers performance.
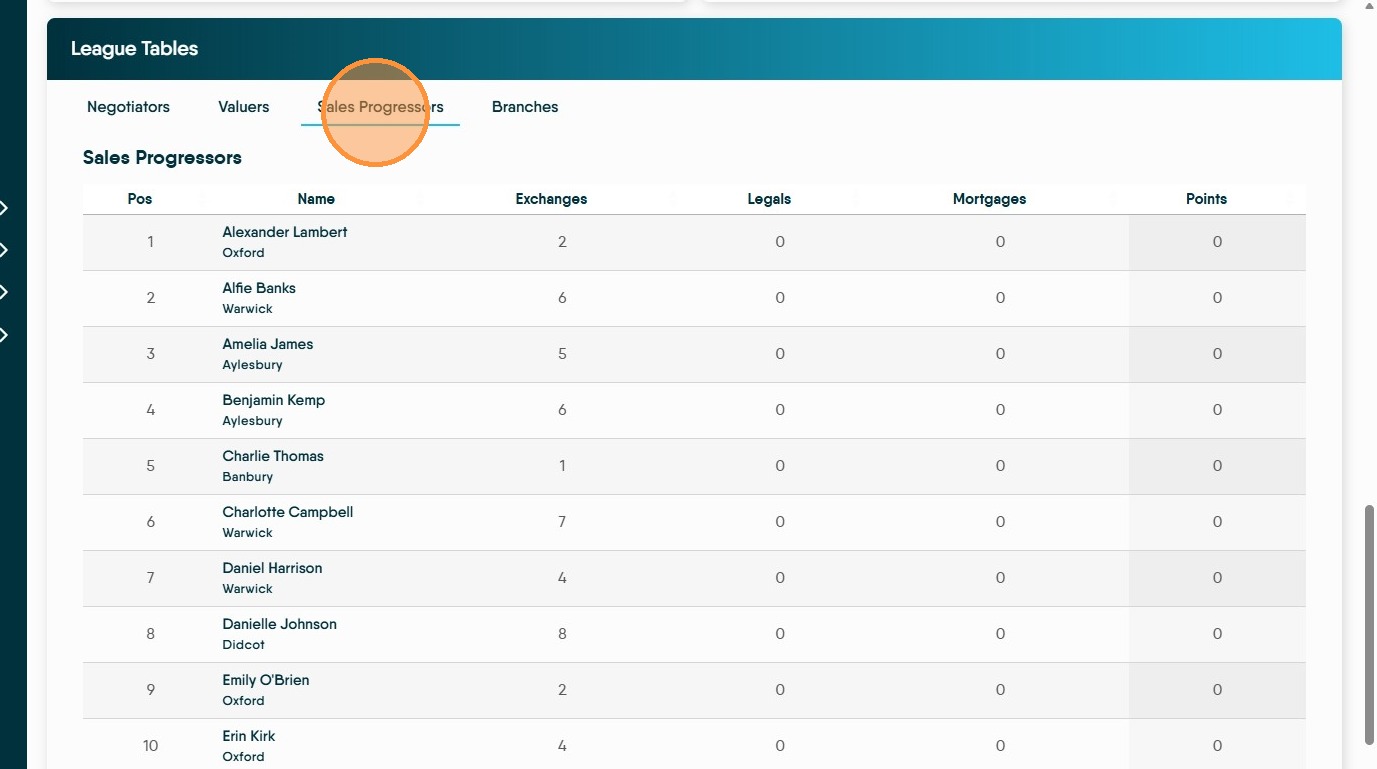
15. Select the "Sales Progressors" tab, this gives 4 metrics that can be used to asses the Progressors performance.
If you do not have Sales Progressors in your company this can be turned off by Support.
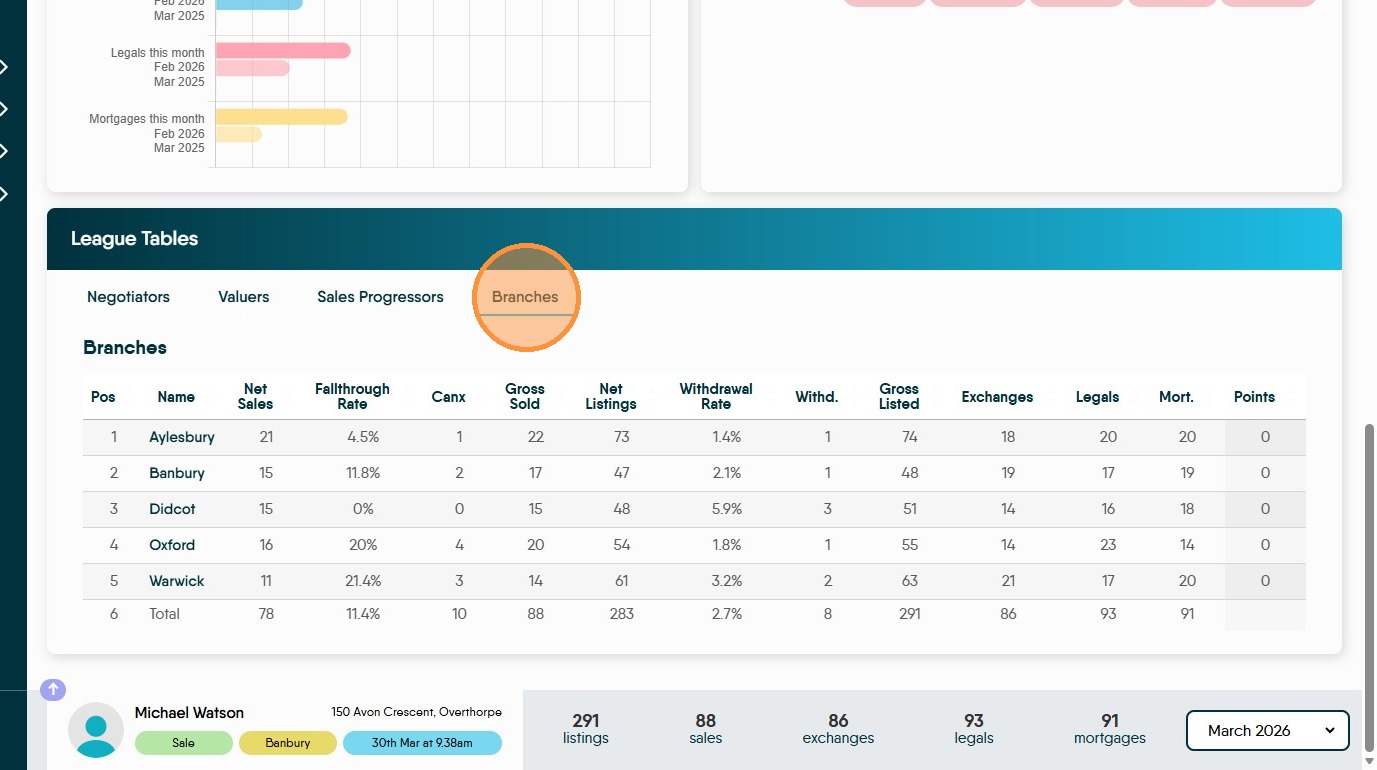
16. Select the "Branches" tab within the League Tables there are 12 metrics that can be used to rank the performance of branches.
At the very bottom of the screen there is displayed, the total figures for the selected month for (in this example) all branches.
17. Selecting a specific month from the date picker filters ALL the on screen reports by time period selected.