This guide provides essential instructions for effectively utilising the Lettings Reporting Dashboard, enabling users to access and analyse key data for their branches. It covers how to filter reports by date range and branch, ensuring tailored insights into lettings performance. By following this guide, users can enhance their understanding of property management metrics, streamline reporting processes, and make informed decisions based on comprehensive data analysis.
Please note you will need to have access to the Reporting Dashboard Module before being able to use this guide.
Details on how to do this are available https://scribehow.com/shared/How_to_add_the_Reporting_Dashboard_module_to_Branches_and_Users__tYLio_soTjGQWhUreatVAg?referrer=workspace
2. Navigate to https://crm.iamproperty.com/MyDay
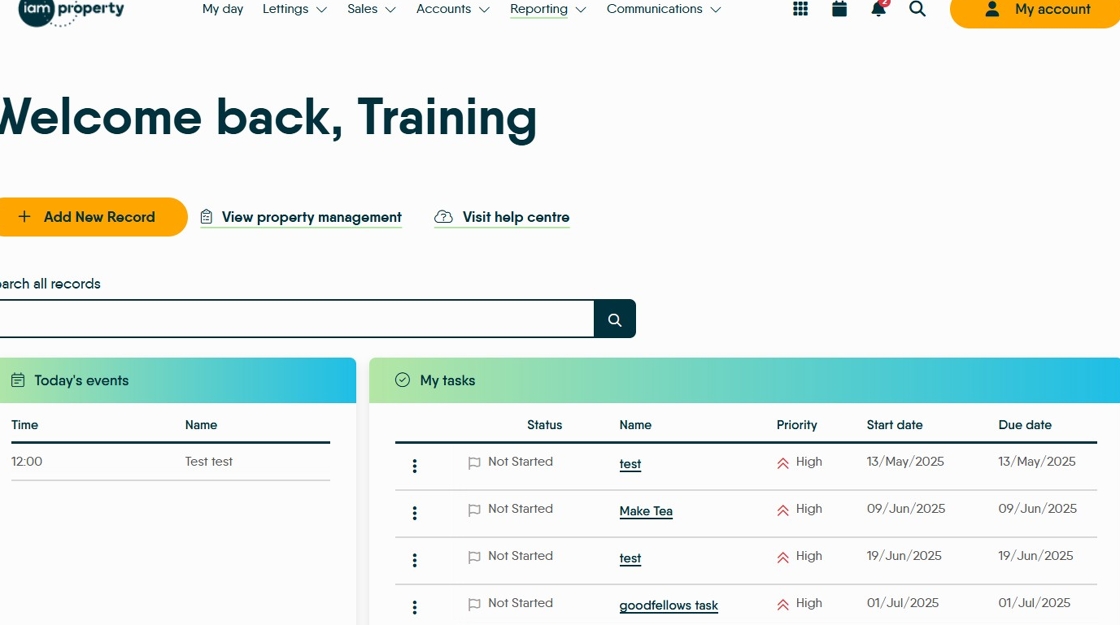
3. Click "Reporting"

4. Click "Reporting Dashboard"

Tip: There are 2 tabs of reporting available:
Sales Reporting - Steps 5 to 14 - This will show you historic reporting for a selected date range.
Sales Pipeline - Steps 15 to 28 - This will show you any upcoming reporting.
5. Click "Lettings Reporting"

6. When you click into Reporting Dashboard, you will first see Lettings Reporting.
By default, you will see figures from the current calendar month, and your user's branch.
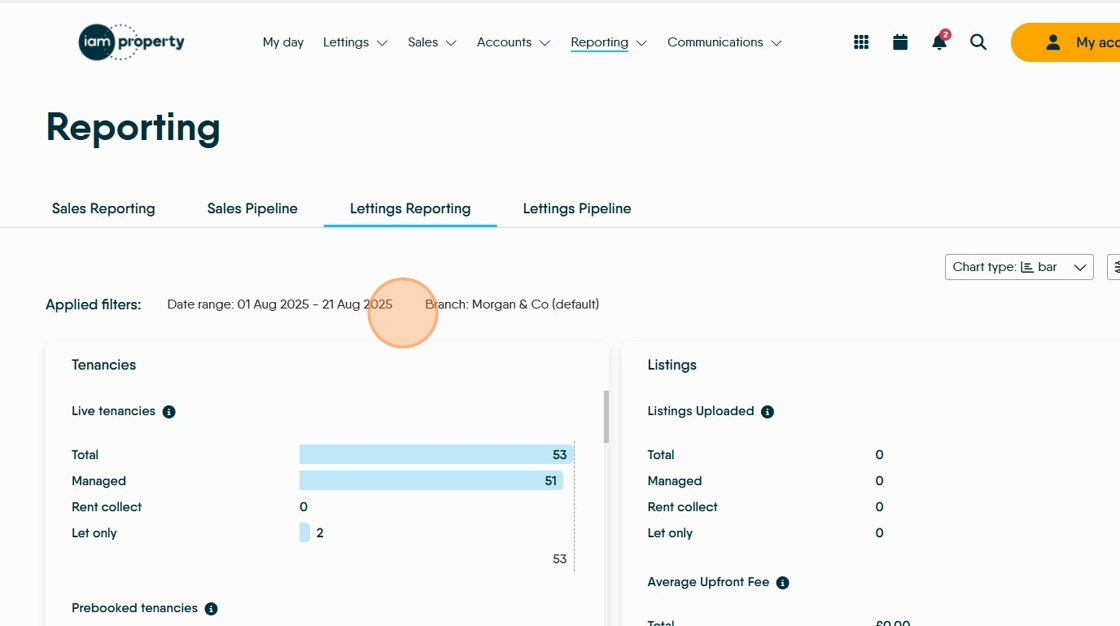
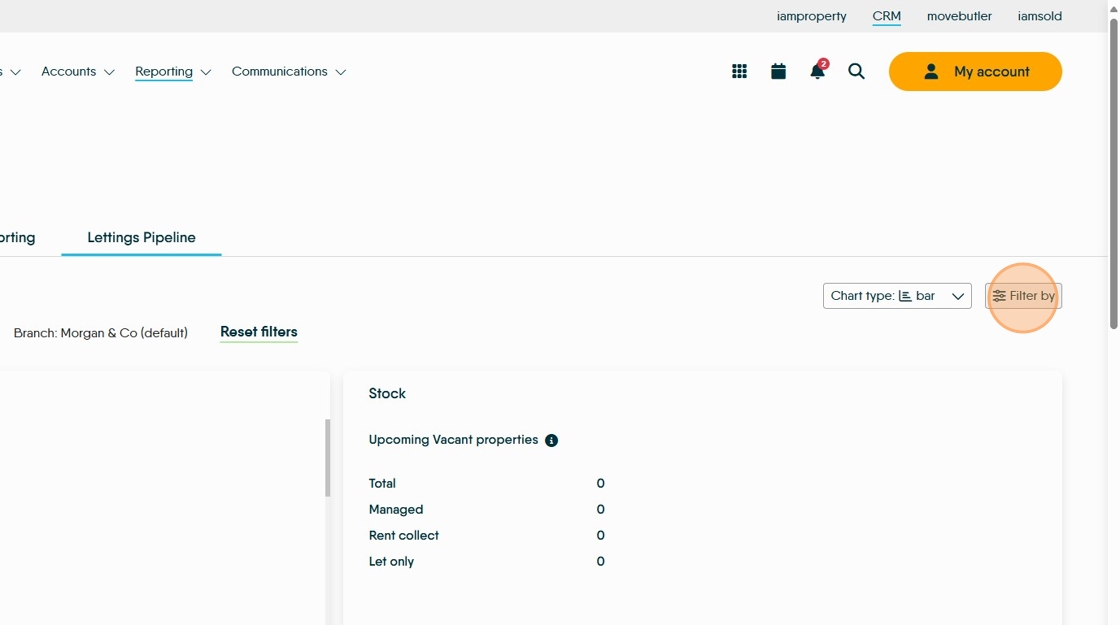
7. To view more branches, or a different date range, click "Filter By"

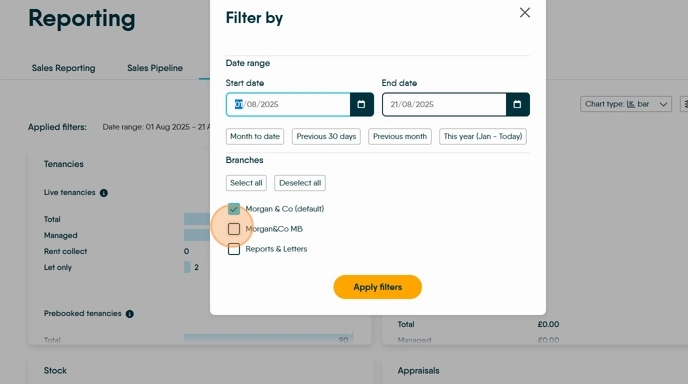
8. To change the date range, you can select one of the standard filters (Month to Date, Previous 30 Days, Previous Month, This Year) or select your own custom date range.

9. You can also select which branches you would like to view.
Click "Apply filters" when you have selected your preferences.
Click "Apply filters"
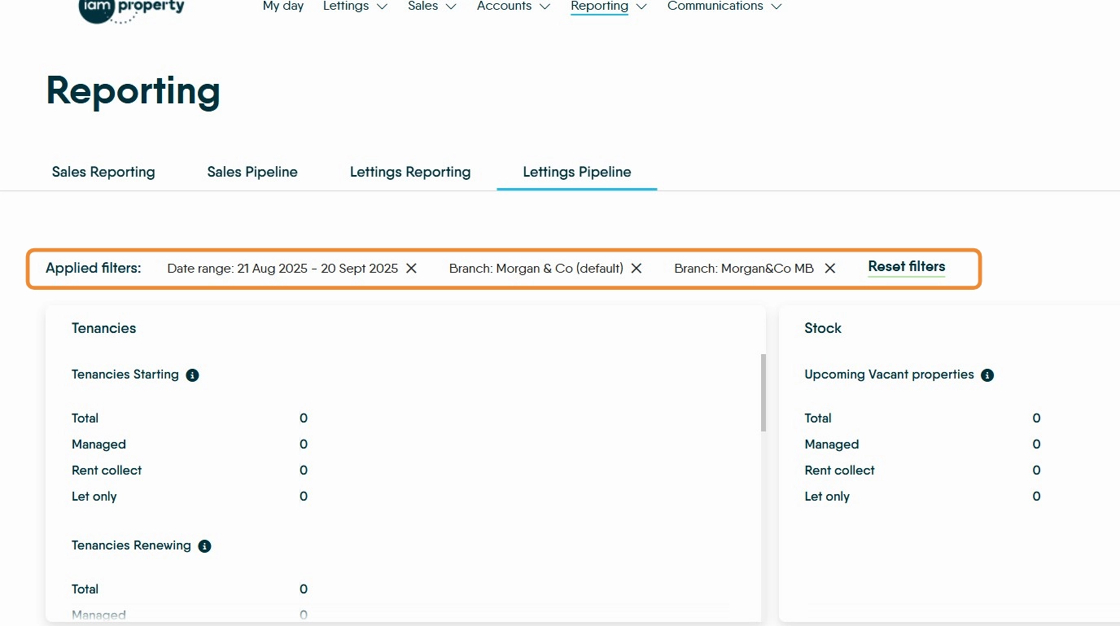
10. You will see your new filters detailed at the top of the page. Click 'Reset Filters' to remove the newly created filters and return to the original configuration.

11. You will now be able to view the combined figures for all your selected branches within your selected date range.
If you are unsure of what any field shows, click the 'i' icon (highlighted) against the category title for more information.

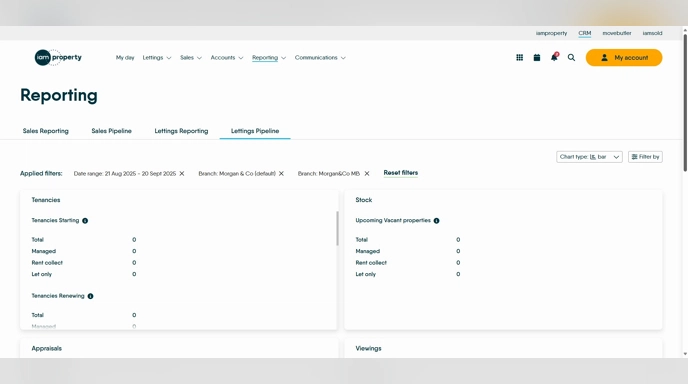
12. To view your selected branches separately, click "Chart Type"

13. Click "Table"

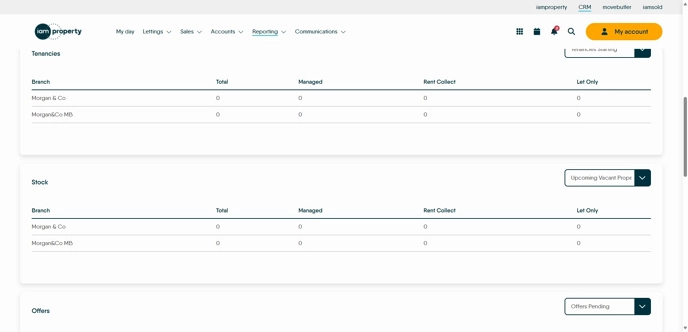
14. You will now see your reporting broken down by branch, in a table view.
Lettings Pipeline
15. Click "Lettings Pipeline"

16. By default, you will see only your user's branch.

17. To view more branches, click "Filter By" then select which branches you would like to view.
Click "Apply Filters"
18. Click "Start date, End date"

19. Click the branches you want to select.

20. Click "Apply filters"

21. The date range and branch filters will show.
22. You will now see your reporting broken down by branch, in a table view.
23. To view individual branch details click "Chart Type"

24. Click "Table"

25. This will show the reporting individually by the branches selected.

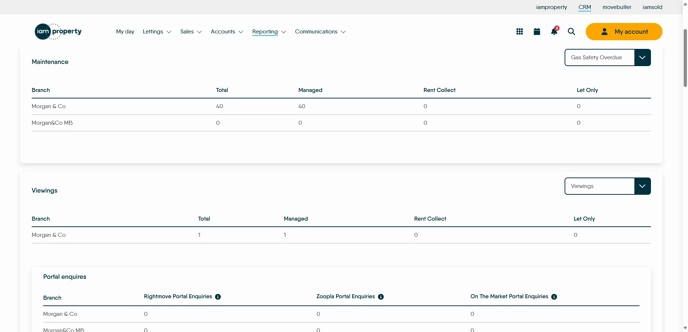
26. In the 'Maintenance' screen, clicking on the drop down menu to the right side shows a menu of all the
Compliance types to view upcoming records.
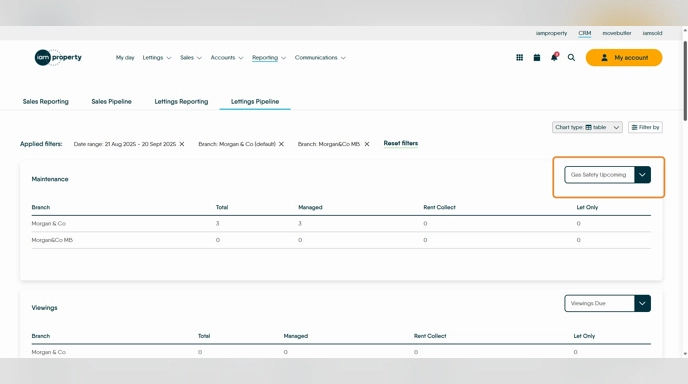
27. The screens in the Pipeline section show the information for each selected branch in Maintenance, Viewings, Tenancies, Stock, Offers, Appraisals, Accounts.
28. The Accounts screens show Upcoming Management Fees and Upcoming Rent Amounts for each property management type.
